The Financial Crisis
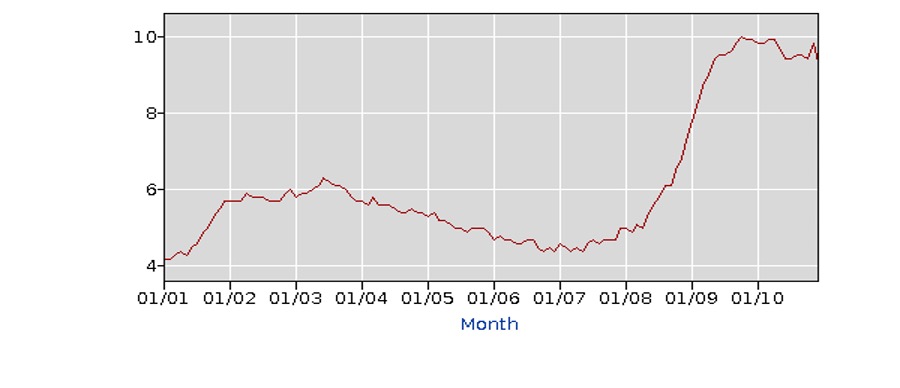
The graph below shows the U.S. unemployment rate over the period 2001–2010. After reaching a peak unemployment rate of 6.3% in June 2003 during the recession following the turn of the century, the unemployment rate began a gradual decline and bottomed out at 4.4% in late 2006 and early 2007. Over a 40-month period, the unemployment rate had dropped 1.9% from 6.3% in June 2003 to 4.4% in October 2006. After hovering around 4.4%, the rate began to increase in June 2007 as the financial crisis began to unfold. From a low of 4.4% in May 2007, the growing financial crisis caused the unemployment rate to gradually increase and top out at 10.0% in October 2009. The unemployment rate increased 5.6% over a period of 29 months before the economic recovery of the financial crisis kicked in.
Unemployment Rate (16 yrs. and older)
2001-2010

Once the economic recovery kicked in, the unemployment rate began a long gradual decline. The table below shows the annual decline in the unemployment rate after peaking at 10.0% in October 2009.
December Unemployment Rate
(Source: Bureau of Economic Analysis)
| 2010 | 2011 | 2012 | 2013 | 2014 | 2015 | 2016 | 2017 | 2018 | 2019 |
| 9.3 | 8.5 | 7.9 | 6.7 | 5.6 | 5.0 | 4.7 | 4.1 | 3.9 | 3.5 |
The unemployment rate reflects a long, gradual, and generally consistent economic expansion following the financial crisis. The unemployment rate was not volatile; it was a gradual decline throughout the decade following the financial crisis.
The Covid-19 Crisis
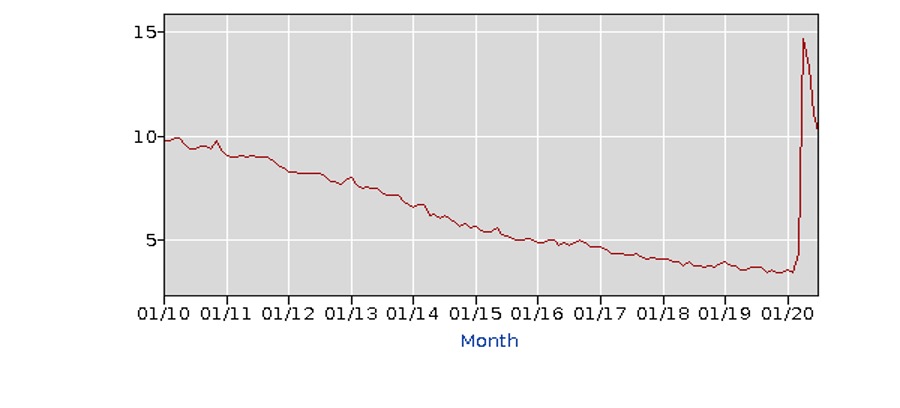
The graph below shows the U.S. unemployment rate over the period 2010 – 2020. The graph reflects what was indicated in the table above, that the unemployment rate gradually and consistently declined throughout the decade following the financial crisis – until 2020. The unemployment rate declined as the longest period of U.S. economic growth began in July 2009 following the financial crisis and continued through February 2020. After peaking at 10.0% in October 2009, the unemployment gradually and constantly trekked lower until it bottomed out at 3.5% in late 2019 and early 2020.
Unemployment Rate (16 yrs. and older)
2010-2020

But the coronavirus changed things. The arrival of the coronavirus in early 2020 prompted many businesses and states to try to minimize the spread of the disease by preventing or limiting social contact, which included restricting economic activity in some degree, such as closing, reducing store hours, and/or limiting customer volume at businesses. It also meant many Americans became concerned for their ability to safely shop, travel, and spend at retail businesses. Consumer spending declined, and increasing unemployment resulted. The table below shows the 2020 unemployment rate through July.
2020 Unemployment Rate: January through July
(Source: Bureau of Economic Analysis)
| January | February | March | April | May | June | July |
| 3.6 | 3.5 | 4.4 | 14.7 | 13.3 | 11.1 | 10.2 |
The impact of the coronavirus began to hit the U.S. economy in March, as the unemployment rate increased to 4.4 % from the 3.5% of February. Covid-19 had a major and dramatic impact in April, with the unemployment rate skyrocketing to 14.7%. In two months, the rate had increased by 11.2%, a much quicker and more significant increase than what occurred during the financial crisis. During the financial crisis, the unemployment rate increased by 5.6% over a period of 29 months, from a low of 4.4% in May 2007 to a high of 10.0% in October 2009.
As states began to relax economic restrictions and businesses reopened, the unemployment rate began declining in May. However, the July unemployment rate of 10.2% still exceeded the peak rate of 10.0% during the financial crisis. The big question – what happens next? If Covid-19 cases and deaths decline in the fall, the unemployment rate will also likely decline. If Covid-19 cases and deaths increase in the fall, unemployment may increase once again. Time will tell.
For further information:
- Unemployment Rate Data from the Bureau of Labor Statistics: Bureau of Labor Statistics

CBEI Series: A Tale of Two Crises–and Recoveries: Financial Crisis vs. COVID-19 Crisis
Part 1: Causes and Cures
Part 2: Economic Growth – Before and During the Crises
Part 3: Unemployment – Before and During the Crises
Part 4: The Federal Reserve and Interest Rates

Kevin Bahr is a professor emeritus of finance and chief analyst of the Center for Business and Economic Insight in the Sentry School of Business and Economics at the University of Wisconsin-Stevens Point.
