The minimum wage has been in the news recently, primarily due to the proposed phase-in of a $15 minimum wage as part of President Biden’s American Rescue Plan. The primary purpose of this blog is to shed some light on the history of the minimum wage, including the changes in the minimum wage since its inception and how minimum wage earnings compare to the Federal Poverty Level (FPL).
The federal minimum wage has its roots in the 1938 Federal Labor Standards Act (FLSA). The minimum wage was initially set at $0.25 per hour. The 1938 Act generally applied to employees engaged in interstate commerce or in the production of goods for interstate commerce. Over the years the minimum wage has periodically been increased and amendments to the original law expanded the categories of workers covered by the minimum wage. A brief summary of some of the significant amendments and changes to the minimum wage law is presented below, with more details provided in the links provided at the end of the blog:
- 1949 – Minimum wage coverage was expanded to include workers in the air transport industry; the minimum wage was raised from 40 cents an hour to 75 cents an hour for all workers.
- 1961 – Application of the FLSA to the retail sector was greatly increased. Minimum wage coverage was extended to employees in large retail and service enterprises as well as to local transit, construction, and gasoline service station employees. Coverage was extended to employees of retail trade enterprises with sales exceeding $1 million annually; however, individual establishments within those enterprises were exempt if their annual sales fell below $250,000. The 1961 amendments significantly increased coverage in the retail trade industry from approximately 250,000 workers to 2.2 million. The minimum wage for previously covered workers was also increased to $1.15 an hour effective September 1961 and to $1.25 an hour in September 1963.
- 1966 – Congress further broadened coverage in the retail sector with amendments that lowered the sales volume test for enterprises to be subject to the minimum wage law. The 1966 amendments also expanded FLSA coverage to public schools, nursing homes, laundries, and the entire construction industry. Subject to certain conditions, farms were subject to coverage for the first time.
- 1977 – Categories of workers covered by amendments sometimes had a lower minimum wage that was applicable to their category. The 1977 amendments set a new uniform wage schedule for all covered workers. In addition, a phased-in increase to the minimum wage occurred with increases to $2.65 an hour in January 1978, $2.90 in January 1979, $3.10 in January 1980, and $3.35 in January 1981.
- 2007 – Amendments provided another phased-in increase to the minimum wage to $5.85 per hour effective July 24, 2007; $6.55 per hour effective July 24, 2008; and $7.25 per hour effective July 24, 2009.
Not all workers are covered by the minimum wage law. Categories of workers not covered by minimum wage laws include independent contractors, and certain categories of farmworkers and professional workers. In addition, there are special rules that apply to workers who earn tips, young workers, and student workers.
Table 1 below shows the minimum wage by effective date for most categories of workers, and the approximate time between increases since 1938. Prior to 1977, select categories covered were subject to a lower minimum wage. (Greater detail is provided in the links below.) The U.S. is currently in the midst of the longest period where the minimum wage has not changed.
Table 1 – Federal Minimum Wage
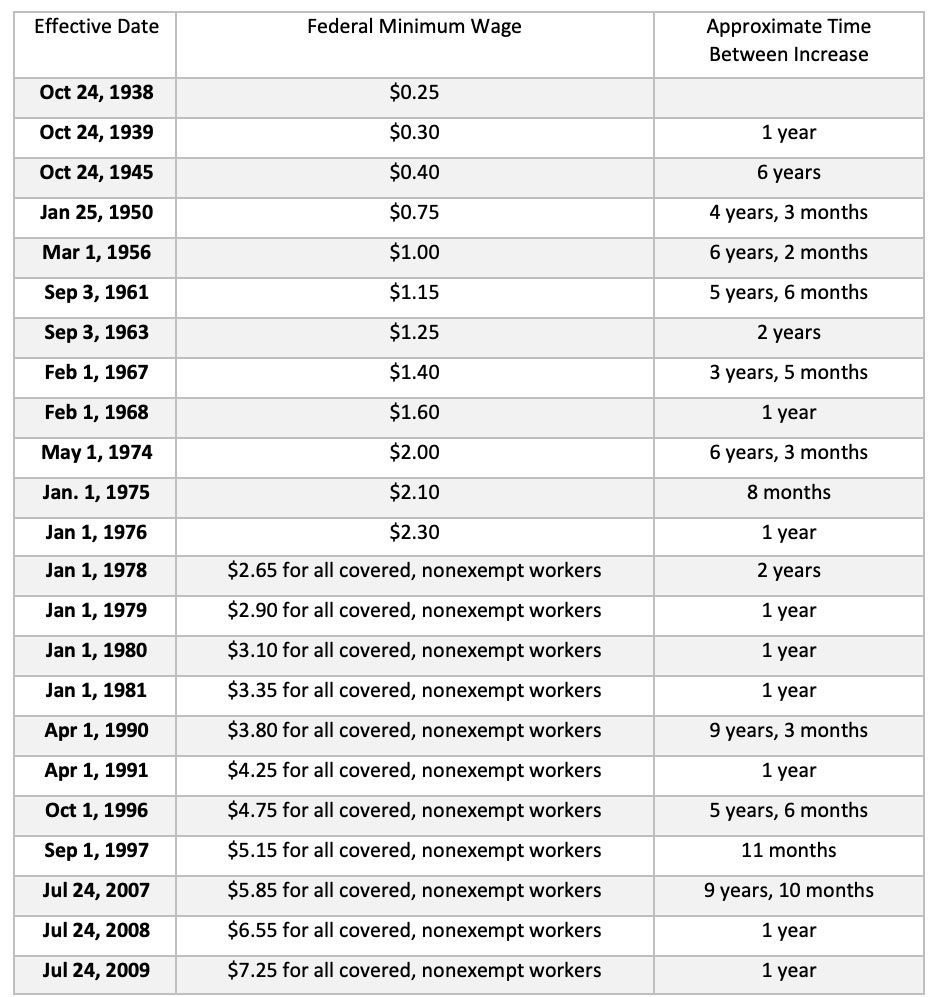
Table 2 below shows the annual earnings of a minimum wage worker as a percentage of the Federal Poverty Level (FPL) for 1 person, 2 person, and 4 person households each year since 1970. The FPL shown is for the 48 contiguous states and the District of Columbia. The FPL for Hawaii and Alaska varies slightly.
Table 2 – Federal Poverty Level (FPL) by Household Size and Minimum Wage Earnings as a % of FPL
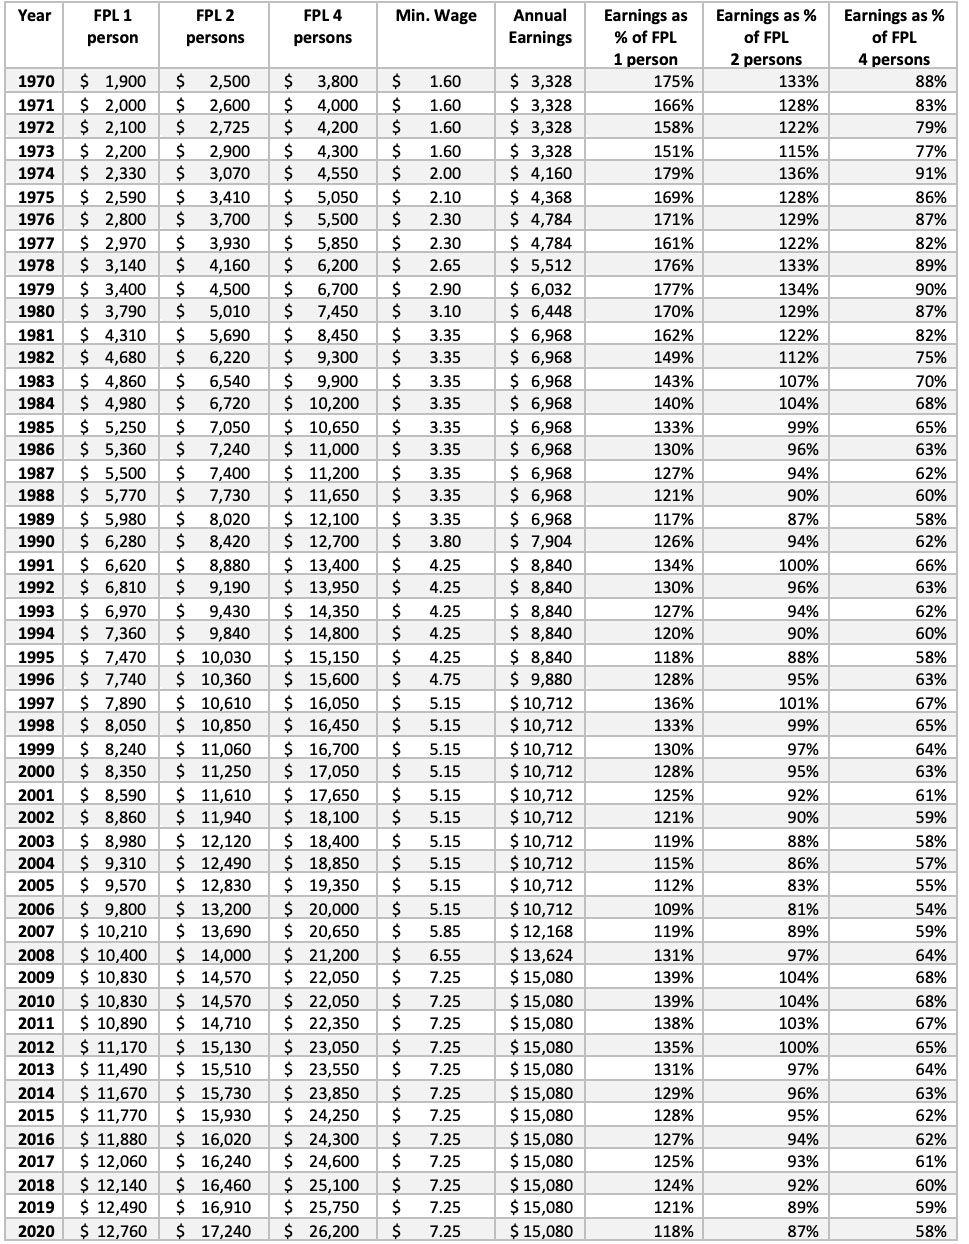
Since 1970, 1974 is the benchmark year for the annual earnings of a minimum wage worker being at the highest percentage of the federal poverty level; 2006 is the benchmark year for the annual earnings of a minimum wage worker being at the lowest percentage of the federal poverty level. The annual earnings of a minimum wage worker as a percentage of the federal poverty level for a household size of one has varied between 179% in 1974 to a low of 109% in 2006. In 2020, the annual earnings of a minimum wage worker comprised 118% of the federal poverty level for a household size of one. The annual earnings of a minimum wage worker as a percentage of the federal poverty level for a household size of two has varied between a high of 136% in 1974 to a low of 81% in 2006. In 2020, the annual earnings of a minimum wage worker comprised 87% of the federal poverty level for a household size of two persons. The annual earnings of a minimum wage worker as a percentage of the federal poverty level for a household size of four has varied between a high of 91% in 1974 to a low of 54% in 2006. In 2020, the annual earnings of a minimum wage worker comprised 58% of the federal poverty level for a household size of four persons.
Discussions regarding the minimum wage have been a political and economic issue since the Great Depression. Those discussions will likely continue; hopefully, this blog provides some historical insight.
For further information:
- From the U.S. Department of Labor, further details on the history of the federal minimum wage and changes to the minimum wage caused by amendments to the FLSA:
U.S. Department of Labor – Minimum Wage Chart
U.S. Department of Labor – Minimum Wage History - From Nolo.com, exemptions from the federal minimum wage law and greater info on state minimum wage laws:
Your Right to the Minimum Wage Law - From the Social Security Administration, based on data from the U.S. Department of Health and Human Services:
Federal Poverty Level Guidelines by Household Size
Related News:
WJFW Newschannel 12: Economist says raising minimum wage would benefit everybody

Kevin Bahr is a professor emeritus of finance and chief analyst of the Center for Business and Economic Insight in the Sentry School of Business and Economics at the University of Wisconsin-Stevens Point.