The rate of inflation in the United States is generally measured by the change in the Consumer Price Index (CPI), which is a weighted average of prices for a basket of consumer goods and services, including transportation, food, and medical care. The U.S. Bureau of Labor Statistics reports the change in the CPI each month.
In May, the annualized rate of inflation in the United States reached 5%, a relatively high level for the United States. Chart 1 below shows the 12-month percent change in the CPI between May 2020 and May 2021. Two lines are shown, the blue line indicates the change in prices for all items in the CPI and the red line indicates the change in prices after food and energy are backed out. As the chart shows, since March 2021 inflation has really kicked in – the annualized rate of inflation has approximately doubled from 2.5% to 5.0%. When food and energy prices are backed out, the annualized rate of inflation has increased from approximately 1.5% to almost 4%.
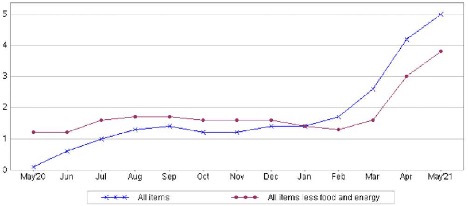
12-month Percent Change in CPI for all Urban Consumers, not seasonally adjusted
As Chart 1 indicates, the annualized inflation rate of 5% in May 2021 is high relative to the past 12 months. While an annual rate of inflation for the entire 2021 year is yet to be determined, a 5% rate would be the highest since 1990. Chart 2 below shows the annual rate of inflation over the period of 1990 – 2020. After peaking at over 5% in 1990, the annual rate of inflation generally fluctuated between approximately 2% and 3% until the financial crisis. After hitting nearly 4% in 2008, since the financial crisis the annual inflation rate has generally been below 3%.
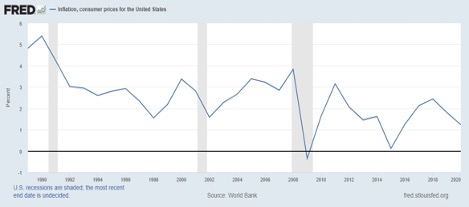
U.S. Annual Rate of Inflation 1990-2020
What’s driving the recent spike in the inflation rate?
The recent spike in inflation can be attributable to 3 main factors: 1) The realization of pent-up demand, particularly in the travel, leisure, and hospitality industries, as the U.S. economy reopens and concerns over COVID-19 are mitigated, 2) energy prices, and 3) supply chain disruptions.
Many products and services related to the travel, leisure, and hospitality industries have seen significant price increases as pent-up demand has been realized through the reopening of the U.S. economy as COVID-19 concerns are mitigated. Cars and trucks, bikes, airfares, and hotel lodging have generally seen substantial price increases as the economy rebounds from COVID-19. According to the Bureau of Labor Statistics, in May the prices of used cars and trucks rose 7.3% and airfares increased 7.0%. Between May 2020 and May 2021, the price of hotel lodging increased 10.0%; airfares increased 24.1%; and sporting goods (including bikes) increased 9.0%.
As concerns over COVID-19 have been mitigated, the rebounding of global economies and increased demand for travel in the U.S. have contributed to a rise in energy prices, particularly gas prices. According to the Bureau of Labor and Statistics, energy prices increased 28.5% between May 2020 and May 2021, with gasoline prices increasing 56.2%. Gas prices tanked when COVID-19 hit. According to the U.S. Energy Information Administration, the U.S. average price for a gallon of regular gas at the start of 2020 was $2.49; by the end of April, the price was only $1.66.
In addition to the obvious increase in travel costs, the increase in fuel costs typically leads to an increase in shipping and transportation costs, which leads to another round of higher prices on a variety of consumer goods – including food. A myriad of factors affect food prices, including fuel costs, weather conditions, and production and supply chain disruptions caused by the pandemic. The increased pressure on food prices will likely continue through 2021.
Chart 3 below shows the change in oil prices since January 2016. Oil prices steadily rose from approximately $30 per barrel at the beginning of 2016 to over $70 per barrel by the end of 2018. Prices stabilized at around $60 in 2019 before plunging to below $20 per barrel in April 2020, reflecting the dramatic economic decline throughout the world caused by COVID-19. As economic activity has rebounded in the U.S. and globally, so have oil prices. Expanding economic output, increased demand for travel, and output restrictions by OPEC, have all contributed to an approximate four-fold increase in the price of oil over the past year. The price of oil exceeded $65 per barrel in May 2021. However, although the price increase has been significant over the past year, the price of oil in May 2021 was approximately equal to what it had been two years earlier in 2019.
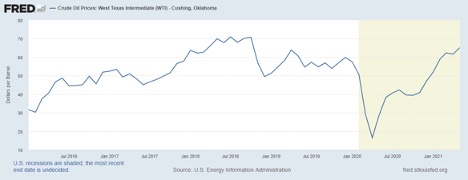
Crude Oil Prices (dollars per barrel) January 2016 – May 2021
The impact of COVID-19 on supply chains still remains for many products (like semiconductors), causing bottlenecks, shortages, and price increases. In the U.S., thankfully COVID-19 vaccinations have led to a mitigation of COVID-19 concerns. However, COVID-19 has not been eradicated. The continued economic impact of COVID-19 varies by country, and supply chain disruptions and production impacts will likely decrease but remain through 2021 for many products. Any resurgence of COVID-19 would once again increase the stress and disruptions on supply chains.
How concerning is the recent spike in the inflation rate?
The financial markets don’t seem to find the annualized May 2021 inflation rate of 5% a cause for concern. Certainly, any price increase is challenging for consumers; however, the price increases resulting from the economic rebound following the pandemic were largely expected. Demand for travel, leisure, and hospitality products and services was building for over a year. Price increases resulting from the surge in demand as the economy reopened was expected. The United States and economies around the world are recovering, contributing to a run-up in energy prices in 2021. Oil prices, however, have only returned to their 2019 level. The economic effects of COVID-19 on supply chains have decreased, but impacts remain, and the recovery of supply chains will likely continue through 2021.
The U.S. financial markets provide insight as to expectations for the U.S. economy. Perhaps most importantly, given the current political environment, they provide a nonpartisan look at what is expected for the economy. Both the stock market and bond market indicate that the ramp-up in inflation in early 2021 is not expected to continue long-term.
The S&P 500 is a diversified index that measures the stock performance of 500 relatively large companies (it is a “large-cap” index, generally comprised of companies having a total stock value exceeding $10 billion). It is generally viewed as the best measure of the performance of U.S. large-cap (company) stocks. Generally, changes in the index reflect expectations for changes in corporate earnings.
If inflation was expected to derail the current economic recovery, it would be reflected in stock prices and the returns of the S&P 500. That hasn’t happened. As of early June, the year-to-date performance of the S&P 500 index has been excellent. As of early June, the year-to-date increase in the S&P 500 was approximately 13%. For comparative purposes, the long-run average annual return (since 1926) on large-cap stocks is approximately 12 percent. In less than six months, the return of the S&P 500 in 2021 has exceeded the historical average annual return on large-cap stocks.
Inflationary expectations are also reflected by the bond market through changes in interest rates. A variety of factors affect interest rates – inflation is one of those factors. Inflation and interest rates are related. An increase in expected inflation will be reflected by an increase in interest rates, particularly medium and long-term interest rates. Investors want to have a greater return than the rate of expected inflation. As a result, increases in expected inflation will generally be reflected in the bond market.
The chart below shows the Treasury yield curve on June 11, 2021 relative to January 4, 2021. The Treasury yield curve shows the interest rates on Treasury bonds with different maturities – it shows the relationship between short-term and long-term interest rates.
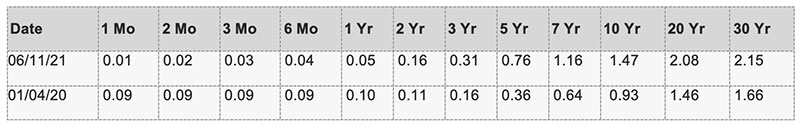
Interest rates have increased slightly across medium and long-term maturities. The interest rate on 5-year bonds increased 40 basis points, from 0.36% to 0.76%. The interest rate on 20-year bonds increased only 62 basis points, from 1.46% to 2.08%. The bond market does not reflect an expected continuation of significant inflation. Interest rates have increased only slightly, and interest rates across all maturities are still at relatively low historical levels, with the 30-year bond rate at only 2.15%.
The ultimate impact of long-term inflation on the U.S. economy is yet-to-be-determined. Pent-up demand, energy prices, and supply chain disruptions created a significant increase in inflation in the first half of 2021. However, the financial markets indicated that price increases were expected as the economy recovers. Many price increases were viewed as “one-time” pops rather than expected to continue over the long-term. U.S. financial market performance has not been deterred by inflation. Through early June 2021 the year-to-date stock market performance was strong, and bond market interest rates increased only slightly. Hopefully, the financial markets expectation that increased inflation is only a temporary phenomenon will be correct.
For further information:
- Information on the recent CPI From the Bureau of Labor Statistics: www.bls.gov/news.release/pdf/cpi.pdf
- Federal Reserve Economic Data (FRED) for the annual inflation rate: U.S. Annual Inflation Rate
- Federal Reserve Economic Data (FRED) for oil prices: Oil Prices
- From the U.S. Treasury: The Yield Curve
- From the U.S. Energy Information Administration: Gas Prices

Kevin Bahr is a professor emeritus of finance and chief analyst of the Center for Business and Economic Insight in the Sentry School of Business and Economics at the University of Wisconsin-Stevens Point.