
The stock market has been up, down, and all around in January. For the week ending Jan. 21, 2022, the S&P 500, a benchmark for large company stocks (a large-cap index), fell 5.7% and the NASDAQ, a technology heavy stock index, declined 7.6%. That was the worst week for the market since the first quarter of 2020, when the onslaught of COVID drove U.S. and international stock prices significantly lower.
What’s behind the volatility? Part of the cause is the stellar performance of the stock market over the past three years which led to relatively high stock valuations. The uncertainty over the pending rise in interest rates is another factor in an increasingly volatile market.
The table below shows recent returns for the S&P 500 and the NASDAQ since 2019. Stock market returns were generally excellent over the past three years. Even in 2020, when market indexes significantly declined in the first quarter due to the onset of COVID, the stock market more than fully rebounded later in the year. Arguably, the stock market returns of the past three years were not sustainable. For comparative purposes, the long-run average annual return (since 1926) is approximately 12 percent on large-cap stocks.
U.S. Stock Market Returns – Percentage Changes
Source: Morningstar

Arguably, the stock market rose too aggressively relative to corporate earnings and economic uncertainty. The most common multiple used in stock valuation is the Price-to-Earnings (P/E) ratio, the stock price per share divided by the earnings per share. The multiple reflects how $1.00 in earnings per share for a firm translates into the firm’s stock price. For example, if earnings per share are $1.00 and the P/E multiple equals 10, then the stock price will be $10.00.
Historically, the mean P/E ratio for the S&P 500 is approximately 16. The multiple generally increases when growth in corporate earnings is expected to accelerate or the risk of the stock market decreases. The multiple generally declines when growth in corporate earnings is expected to decrease or the risk of the stock market increases. According to Morningstar, the annual average P/E ratio for the S&P 500 rose from 15.0 in 2012 to 22.6 in 2019. In late 2021, the P/E ratio for the S&P 500 exceeded 30. In 2021, the S&P 500 multiple of earnings was generally much higher than the historical average, and much higher than the multiple over the past decade. Although strong economic growth returned in 2021 and corporate profits were at record levels, there was continued economic uncertainty over supply chain issues, inflation, and COVID. And the stock market hates uncertainty. Uncertainty breeds volatility in stock prices, a reduced market multiple, and consequently a pullback (correction) from recent gains.
In December, as annualized inflation increased to 7%, the Federal Reserve signaled that interest rate increases were likely in 2022. Although a variety of factors influence interest rates, the Federal Reserve’s monetary policy (buying and selling Treasury securities) strongly influences the movement of interest rates. The Federal Reserve targets the fed funds rate, a very short-term interest rate, which is the overnight borrowing rate between banks. When the Federal Reserve changes this rate, there is generally a rippling effect on other interest rates in the financial markets. Lower interest rates generally increase consumer spending. Higher interest rates generally lower consumer spending. Lower consumer spending could lower inflation by reducing consumer demand and lower stock prices through decreased corporate profits. The goal of the Federal Reserve – balance economic growth with acceptable levels of inflation.
It should be no surprise that interest rates will increase in 2022. The consternation of the stock market appeared to be related to the uncertainty over the magnitude and timing of interest rate increases rather than if they will happen. Even with expected interest rate increases in 2022, interest rates will still be at relatively low levels. Recent stock market performance benefited from historically low interest rates.
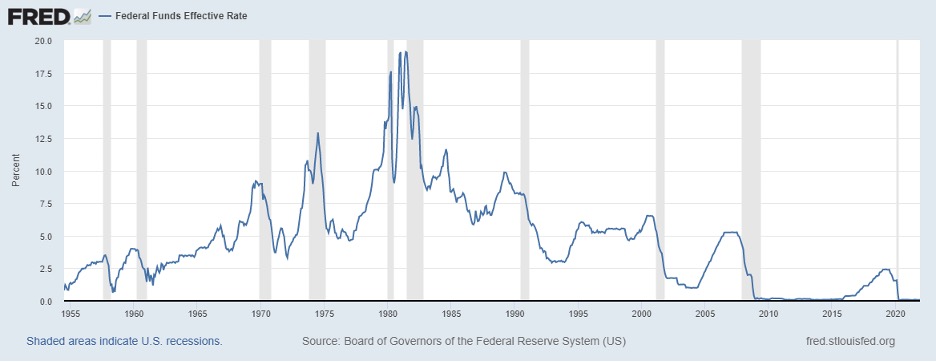
The graph below shows the effective (market) fed funds rate since 1955. Currently, interest rates are abnormally low. Only twice since 1955 has the Federal Reserve targeted the fed funds rate at a historically low 0.00-0.25% – following the financial crisis and following COVID. When the economy rebounds, the Fed gradually increases interest rates in seeking to balance economic growth with inflation, with inflation becoming more likely as consumer demand increases with employment. Following the financial crisis, the Federal Reserve began gradually increasing interest rates in 2015 as economic growth continued. As recently as 2018 and 2019, the Federal Reserve targeted the fed funds rate above 2.00%. So, even with expected interest rate increases in 2022 from the historically low target of 0.00-0.25%, interest rates will still be at relatively low levels.
Federal Funds Effective Rate 1955-2022

The challenge for the Federal Reserve is that today’s economy is different from anything in the past. The interaction of demand and supply determines price levels. If demand increases for a given supply, prices increase. Likewise, if supply decreases for a given demand, prices increase. The annualized inflation rate of 7% that was reached in December 2021 was the highest since the early 1980s. Inflationary pressures resulted from a combination of increased demand as the economy rebounded from COVID, and reduced supply resulting from COVID related supply chain issues.
Increased demand was bolstered by the economic recovery. Between April 2020 and December 2021 approximately 19 million jobs were added back to the economy and the unemployment rate reduced from 14.7% to 3.9%. Although job growth was significant, the 149 million employed at the end of 2021 was still 3 million short of the number employed in February 2020. The 3.9% unemployment rate in December 2021 was still higher than the 3.5% unemployment rate in February 2020. In February 2020 the annualized inflation rate was 2.3%; in December 2021, the annualized inflation rate was 7.0%. A key difference? Supply chain issues (including energy) that existed in December 2021, but didn’t exist in February 2020, significantly contributed to the rapid rise in inflation in 2021.
Increasing interest rates can reduce consumer demand and lower inflationary pressures – to a point. A challenge for the Federal Reserve is to dampen inflation without raising interest rates too much so that economic growth is unduly constrained or even reversed. Another challenge for the Federal Reserve – it can strongly influence interest rates, but not the supply chain. In other words, its control over current economic challenges is limited.
Although the road to economic recovery since the onset of COVID has been strong, there have been a few bumps in the road. Economic fundamentals such as economic growth and employment have remained strong, but inflation and COVID driven supply chain issues have created problems. And the two are related – COVID driven supply chain problems significantly contributed to the inflation problem. The stock market rose significantly in 2021 with stocks increasing to relatively high valuations despite the inflation and supply chain problems, and the uncertainty created by those problems. As 2022 begins, addressing inflation has become a priority for the Federal Reserve. And whatever the Federal Reserve does, financial markets will watch closely. An expected increase in interest rates in 2022 can temper consumer demand, but interest rates should still be at relatively low levels. But that is only part of the inflation issue. The Federal Reserve can strongly influence interest rates, but not the supply chain. Until global supply chain issues are resolved, inflationary pressure from the supply side will remain.
For further information:
- The targeted fed funds rate from the Federal Reserve: Fed Funds Rate
- From Morningstar, info on S&P 500 performance and the financial markets: S&P 500 Returns
- Info on historical inflation from the Federal Reserve Economic Database (FRED): FRED Database – Inflation
- Information on the recent CPI from the Bureau of Labor Statistics: https://www.bls.gov/news.release/pdf/cpi.pdf
- Info from the Bureau of Labor Statistics:
- From NASDAQ Data Link: S&P 500 P/E Ratio by Month

Kevin Bahr is a professor emeritus of finance and chief analyst of the Center for Business and Economic Insight in the Sentry School of Business and Economics at the University of Wisconsin-Stevens Point.
