Is the U.S. heading into a recession? Historically, the yield curve has been a pretty good indicator of pending recessions. However, it is not foolproof, and cannot predict the duration and severity of recessions.
The chart below shows the Treasury yield curve on September 8, 2022. The yield curve is a graphical representation of the term structure of interest rates. In other words, the yield curve shows the relationship between short-term and long-term interest rates for securities with equal default risk, but different maturities. The yield curve is “inverted” when short-term rates are greater than long-term rates. Note that on September 8, 2022 the yield curve was slightly inverted when the 10-year yield (3.29%) is compared to the 2-year yield (3.48%), but an inversion does not occur when the 10-year yield (3.29%) is compared to the 3-month yield (3.06%).
Treasury Yield Curve Rates
| Date | 1 Mo | 2 Mo | 3 Mo | 6 Mo | 1 Yr | 2 Yr | 3 Yr | 5 Yr | 7 Yr | 10 Yr | 20 Yr | 30 Yr |
| 09/08/22 | 2.57 | 2.86 | 3.06 | 3.44 | 3.60 | 3.48 | 3.54 | 3.39 | 3.37 | 3.29 | 3.69 | 3.45 |
The yield curve for U.S. Treasury securities, which are assumed to have zero default risk, is typically a benchmark for predicting U.S. economic recessions. Specifically, the spread (difference) between the yield on long-term (ten-year) U.S. Treasury securities and the yield on short-term (either 2-year or 3-month) U.S. Treasury securities has been used as a predictor of recessions. Both yield curves have been referenced in the financial and business media as predictors of recessions. Both yield curves have been excellent predictors of recessions, but not perfect. Although both spreads tend to move similarly, the 10-year/2-year spread tends to invert more frequently with less volatility than the 10-year/3-month spread.
Figure 1 below shows the slope of the yield curve from January 1982 through September 8, 2022. The blue line shows the slope of the yield curve as measured by the spread (the difference) between the yield on ten-year U.S. Treasury securities and the yield on 3-month U.S. Treasury securities. The red line shows the slope of the yield curve as measured by the spread between the yield on ten-year U.S. Treasury securities and the yield on 2-year U.S. Treasury securities. When a line goes below zero, this indicates that the yield curve has become negative. In other words, the yield curve is “inverted”, and short-term interest rates exceed long-term interest rates. The shading indicates U.S. recessions as stipulated by the National Bureau of Economic Research, which officially designates when recessions have occurred. As the graph indicates, inverted yield curves are typically associated with a near-term recession. Note that the yield curve slope becomes negative before every economic recession.
However, there are a few differences between the predictions of the 10-year/2-year spread and the 10-year/3-month spread. In June 1998 the yield on the 10-year/2-year spread inverted; the 10-year/3-month spread did not. A recession did not materialize. In 2019 as economic growth declined the 10-year/3-month yield curve became negative while the 10-year/2-year spread did not, but arguably the 10-year/3-month spread could not have predicted the 2020 recession caused by the pandemic. However, the predictive nature of the 10-year/3-month spread has been strong. Every recession in the past 60 years has been preceded by an inversion of the yield curve between 3-month and 10-year Treasury securities.
Figure 1: The Yield Curve Slope January 1982–August 2022 (daily)
10-Year U.S. Treasury Yield minus 3-Month U.S. Treasury Yield and
10-Year U.S. Treasury Yield minus 2-Year U.S. Treasury Yield
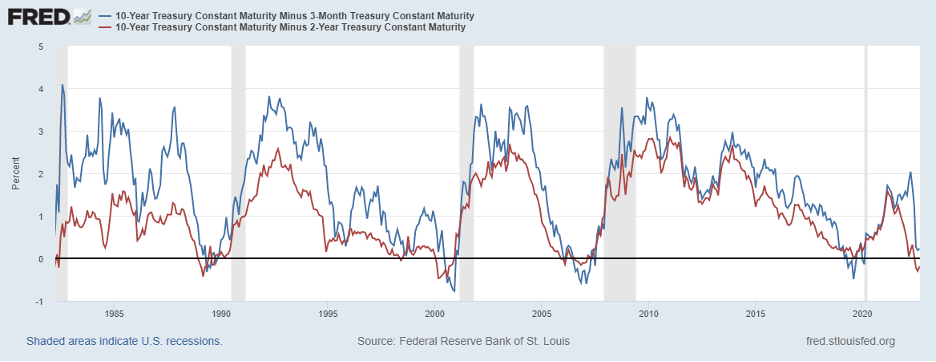
In 2022, when the slope of the yield curve is measured by the spread (the difference) between the yield on ten-year U.S. Treasury securities and the yield on 3-month U.S. Treasury securities, an inversion did not occur through early September 2022. No forecast of a recession. However, when the slope of the yield curve is measured by the spread (the difference) between the yield on ten-year U.S. Treasury securities and the yield on 2-year U.S. Treasury securities, an inversion has occurred in 2022. The yield curve was negative in July and August of 2022. A recession is forecasted.
A significant reason an inverted yield curve can potentially predict a recession is why an inverted yield curve occurs. Generally, the yield curve slopes up (long-term interest rates are generally higher than short-term interest rates). There is generally more inflation in the long-term, and investors and lenders need to be compensated for the higher inflation. In addition, there is generally greater economic risk that attaches to the long-term term. As a result, in the U.S., long-term interest rates are usually higher than short-term interest rates.
An inverted yield curve, when short-term interest rates are higher than long-term interest rates, generally reflects recently increasing short-term interest rates and an expectation that inflation (and interest rates) will decrease in the long-term. Generally, a primary cause of increasing short-term interest rates is the Federal Reserve. The Federal Reserve targets the federal funds rate, a very short-term interest rate, which is the overnight borrowing rate between banks. The federal funds rate is the central interest rate in the U.S. financial market.
When the Federal Reserve changes this rate, there is generally a rippling effect on other interest rates in the financial markets. When the Federal Reserve increases the federal funds rate (by selling from its inventory of Treasury securities and consequently decreasing the money supply), consumer and business spending are reduced as borrowing costs have increased. The reduced spending generally lowers inflation; however, it also lowers economic growth. If economic growth turns negative for two consecutive quarters, generally a recession has occurred. The challenge for the Federal Reserve – increase interest rates to reduce consumer and business demand and decrease inflation while keeping interest rates at a level that fosters economic growth. However, increased interest rates may reduce inflation, but may not foster economic growth. Ideally a “soft landing” occurs when the federal funds rate is increased and economic growth is reduced but remains positive.
Figure 2 below shows the effective federal funds rate since September 1954. The effective federal funds rate is the market rate of overnight federal funds transactions. Since 1954, note that the effective federal funds rate increased before every recessionary period. This certainly does not mean that the Federal Reserve increases the federal funds rate to cause a U.S. recession. Increases in the rate have occurred without a subsequent near-term recession, like in the mid-1990s when Greenspan’s Fed was able to achieve a soft landing after increasing the federal funds rate. It does mean, however, that an economic recession can be a side effect of the Federal Reserve increasing rates. The increased interest rates lower consumer and business spending as borrowing costs have increased. The reduced spending reduces not only inflationary pressures but also economic growth, and the economic growth may become negative. In 2022, the effective federal funds rate has increased from near zero to begin the year to exceeding 2.00% at the end of August.
Figure 2 Federal Funds Effective Rate
September 1954–August 2022
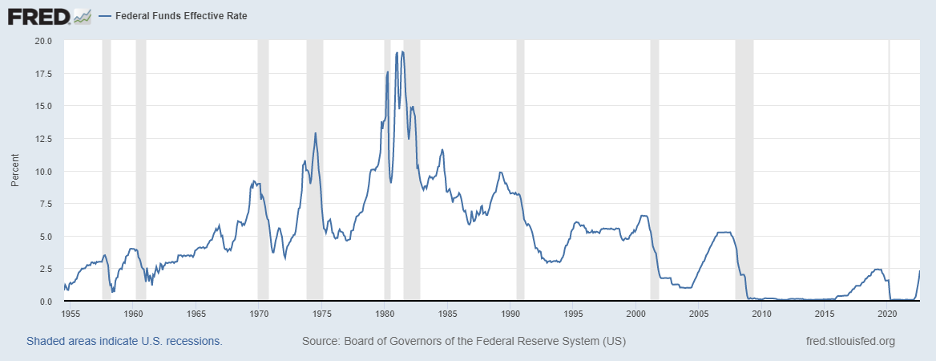
Is the U.S. heading into a recession? Maybe, maybe not. Every recession in the past 60 years has been preceded by an inversion of the yield curve between the 3-month and 10-year Treasury securities. As of August, an inversion has not occurred in 2022. It was close in August, but an inversion did not occur. Since 1954 the effective federal funds rate increased before every recessionary period. However, increases in the rate have also occurred without a subsequent near-term recession. In 2022, the effective federal funds rate has increased significantly since the beginning of the year.
So, the slope of the yield curve has mixed results for forecasting a recession. An increasing effective federal funds rate may also indicate a near-term recession, but not always. In 2022, the effective federal funds rate increased by approximately 2.00% through August.
Recently, a new predictive spread has been endorsed by the Federal Reserve as a predictor of an economic recession. The “near-term forward spread” compares the 3-month interest rate 18 months from now implied by the Treasury market with the current 3-month Treasury bill. The near-term forward spread reflects the bond market’s expectation of Fed rate changes over the coming year and a half. In 2022, similar to the 10-year/3-month spread, the near-term forward spread did not predict a recession.
However, it’s important to remember why an inverted yield curve occurs. An inverted yield curve is typically associated with a recent increase in short-term interest rates driven by the Federal Reserve. While the Federal Reserve may increase the federal funds rate to lower inflation, a side effect that may occur is an economic recession. The increased interest rates lower consumer and business spending as borrowing costs have increased. The reduced spending reduces not only inflationary pressures but also economic growth, and the economic growth may turn negative resulting in a recession.
The challenge for the Federal Reserve – increase interest rates to reduce consumer and business demand and decrease inflation, but have interest rates at a level that still foster economic growth (a “soft landing”). In the current environment that is particularly challenging, as factors outside the Federal Reserve’s control have been primary factors contributing to inflation, including energy prices, supply chain issues, and the effects of Putin’s war on the Ukraine. Only time will tell if the Federal Reserve’s recent increases result in a near-term recession.
For further information:
- From the Federal Reserve: Don’t Fear the Yield Curve, Reprise
- From the U.S. Treasury: Treasury Yields

Kevin Bahr is a professor emeritus of finance and chief analyst of the Center for Business and Economic Insight in the Sentry School of Business and Economics at the University of Wisconsin-Stevens Point.