
Overview
No economic issue was more politicized in the November elections than inflation. It was one of the most important issues to voters, and the most important economic issue. In a rare show of unity, both Democrats and Republicans agreed that inflation was a problem. However, specific short-term solutions to current inflation were more problematic for politicians to identify. While the Federal Reserve began raising interest rates in 2022 to reduce consumer and business spending, legislative actions that would immediately curtail inflation were difficult. There is a reason for that. Inflation is not simply a U.S. problem caused by U.S. policies; it is a global problem created by global factors. Inflation was the top global, economic problem in 2022. U.S. inflation peaked at 9.1% in June but has remained stubbornly high. In October, inflation fell to its lowest rate in 2022, but was still at 7.7%.
Although inflation remains a problem, the 2022 job market has been incredibly strong. In October, there were 153.3 million Americans working, more than at any other time in the history of the United States. The unemployment rate was less than 4.0% since February, and the number of job openings was consistently at near record highs throughout the year. The job market has robustly recovered from the April 2020 COVID driven record high unemployment rate of 14.7% when only 130.5 million were employed.
Economic growth cooled significantly in 2022. The 2020 economic decline caused by COVID was record breaking, as was the post-COVID economic recovery. After declining 4.6% in the first quarter of 2020, economic growth dropped a record 29.9% in the second quarter. The decrease was the worst quarterly decline on record since the Bureau of Economic Analysis (BEA) began tracking quarterly economic growth in 1946 and was much greater than the worst quarterly decline of 8.5% during the financial crisis in 2008. The record drop in economic growth in the second quarter was followed by record growth in the third quarter, as the economy grew at an annualized rate of 35.3%, the highest quarterly growth on record. Although the economy rebounded in the second half of the year, overall economic growth in 2020 declined 2.8%, the largest decrease in annual economic growth since 1946. During the financial crisis the largest annual economic growth decline was 2.6% in 2009. The strong economic growth that returned in the second quarter of 2020 generally carried through 2021. Annual GDP growth in 2021 was 5.9%, the strongest annual growth since 1984. Economic growth was mixed in 2022, with growth returning at a 2.6% rate in the third quarter following declines of 1.6% in the first quarter and 0.6% in the second quarter.
Inflation – Global Factors and the Russian Invasion of Ukraine
The table below shows the annualized inflation rate for Europe, the United Kingdom, Canada, and the United States in 2022 compared to April 2021. Note that the trends in price increases are similar across most countries, with relatively low inflation in April 2021 transitioning to relatively high inflation in 2022. The trends are similar across countries because global factors have impacted global prices. Record levels of inflation were recorded for the United States, the Euro Area, Canada, and the United Kingdom.
Europe, Canada, and U.S. Annualized Inflation Rates
| April 21 | April 22 | May 22 | June 22 | July 22 | Aug. 22 | Sept. 22 | |
| Euro Area | 1.6 | 7.4 | 8.1 | 8.6 | 8.9 | 9.1 | 9.9 |
| Canada | 3.4 | 6.8 | 7.7 | 8.1 | 7.6 | 7.0 | 6.9 |
| United Kingdom | 1.5 | 9.0 | 9.1 | 9.4 | 10.1 | 9.9 | 10.1 |
| U.S. | 4.2 | 8.3 | 8.6 | 9.1 | 8.5 | 8.3 | 8.2 |
The war in Ukraine has played a major role in fueling inflation, particularly through increasing food and energy prices. The U.S. and its allies would pay a price for Putin’s invasion. Economic sanctions against Russia would mean economic costs; there would also be a cost to not doing anything. The costs would be different, but there would be costs incurred no matter what course the United States chose. The United States and NATO allies placed economic sanctions against Russia and provided military support to Ukraine.
According to the U.S. Energy Information Administration (EIA), Russia was the world’s third-largest producer of petroleum and other liquids (after the United States and Saudi Arabia) in 2020 and was the second-largest producer of dry natural gas in 2020 (after the United States). Oil production in Russia far outpaces consumption in Russia. According to the International Energy Administration, Russia is the world’s largest exporter of oil to global markets and the second largest crude oil exporter behind Saudi Arabia. Collectively, the European Union relies heavily on oil imports, with Russia a major supplier of energy. According to Eurostat, the European dependency on imports for oil and petroleum products reached a record high in 2020, with the European Union relying on net imports for 96.96% of its energy needs. In 2020, Russia accounted for approximately one-third of European oil imports. Europe also relies extensively on natural gas imports.
Since Europe placed sanctions on Russia following the invasion of Ukraine, European dependence on Russian energy has decreased, but remains significant. Russia was the largest provider of petroleum to Europe in 2021, comprising 25.9% of oil imports in 2021 but decreasing to 21.3% of imports in the second quarter of 2022. Russia was also the largest supplier of natural gas to the EU with a market share of 39.7% in 2021, but Russia accounted for only 22.9% of EU natural gas imports in the second quarter of 2022.
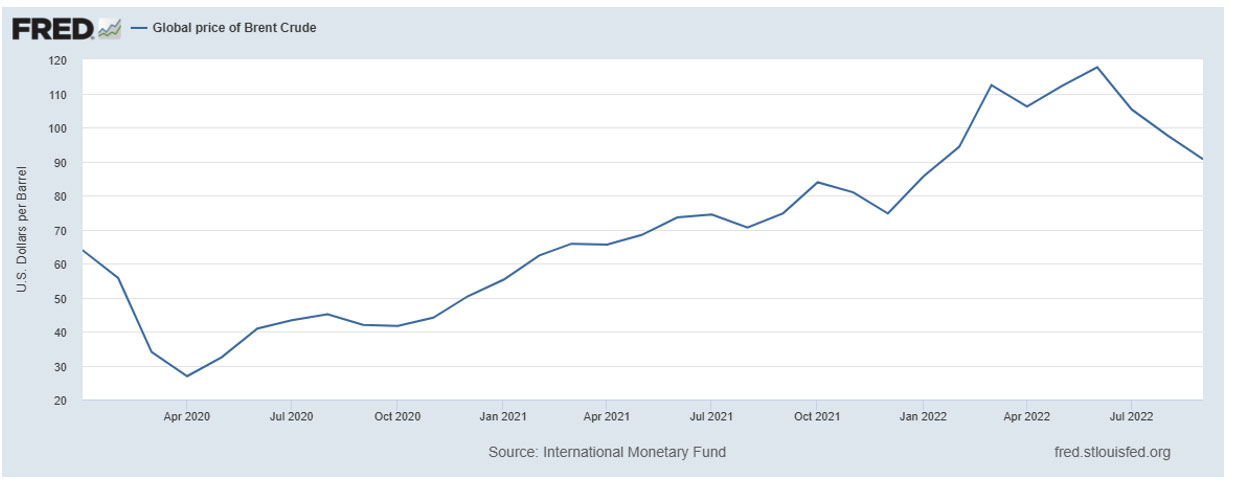
Russia’s role as a leading exporter of oil to global markets combined with their invasion of Ukraine significantly contributed to uncertainty and price increases in energy markets. According to Investopedia.com, Brent Crude is the most widely used global benchmark for oil pricing, with approximately two-thirds of global crude contracts tied to the Brent Crude oil price. The graph below shows global Brent crude oil prices since 2020. After crashing in early 2020 due to the economic contraction caused by COVID, oil prices gradually rose as the global economy recovered and the demand for oil increased. Oil prices appeared to be stabilizing in late 2021. However, oil prices spiked from approximately $75 a barrel in late December 2021 to almost $120 a barrel in June 2022 after Russia invaded Ukraine in February. The increased oil prices not only affected global energy costs, but also transportation costs for goods worldwide, both key factors contributing to global inflation.
Since June, oil prices declined by approximately one-third to around $90 a barrel in October. Multiple factors contributed to the decline, including the global economic slowdown in 2022, fears of a pending recession in 2023, and lower demand from China. In addition, crude oil is generally priced in U.S. dollars, so purchases in other currencies are not only affected by the dollar price of crude oil but also by the exchange rate to the dollar. Generally, the value of the dollar has increased against most currencies as the Federal Reserve aggressively raised U.S. interest rates in 2022, creating more demand for the dollar.
Global Brent Crude Oil Prices
January 2020 – November 2022
How did U.S. oil production respond to the oil market turbulence and uncertainties since COVID? The chart below shows U.S. monthly production of crude oil since January 2020. Note that in early 2020, U.S. oil production decreased by approximately 25%, from 12.8 million barrels per day in January to only 9.7 million barrels per day in May. Why? The graph above shows that the market price of oil drastically dropped from approximately $65 per barrel in December 2019 to nearly $25 per barrel in April 2020 as the demand for oil decreased due to the economic shock caused by COVID. When oil prices tank then oil profits decline, and there is much less incentive for oil production. In 2020, the oil industry had one of its worst years ever as oil prices sank, with many companies reporting losses for the year including ExxonMobil and Shell.
U.S. Field Production of Crude Oil (Thousand Barrels per Day)
Jan. Feb. March April May June July Aug. Sept. Oct. Nov. Dec.
| 2020 | 12,852 | 12,842 | 12,797 | 11,914 | 9,713 | 10,442 | 11,006 | 10,577 | 10,921 | 10,457 | 11,196 | 11,168 |
| 2021 | 11,124 | 9,925 | 11,326 | 11,305 | 11,356 | 11,356 | 11,347 | 11,277 | 10,918 | 11,569 | 11,790 | 11,634 |
| 2022 | 11,369 | 11,316 | 11,701 | 11,668 | 11,629 | 11,797 | 11,873 | 11,975 |
As the economy began to recover in 2020, oil prices rose, and generally so did oil production. Oil prices doubled from their low in April to approximately $50 per barrel by yearend, with production increasing nearly 15% from a low of 9.7 million barrels per day in May to 11.1 million barrels per day in December. Oil prices generally rose gradually in 2021 before peaking at $83 per barrel in October and declining to $75 per barrel by December. Oil production rose approximately 5%, ending the year at 11.6 million barrels per day in December compared to 11.1 million barrels per day in December 2020.
Oil production continued to increase in 2022, from 11.3 million barrels in January to nearly 12 million barrels per day in September. However, production was still less than the pre-COVID January 2020 level of 12.8 million barrels per day. It’s a balancing act for oil companies, as oil prices are affected by both supply and demand. The major focus of oil companies is to maximize profits and returns for shareholders. Increasing output may increase revenues and profits; however, increasing the supply of oil can also lower global oil prices and consequently lower profits. The volatility of the oil market, an expected economic slowdown, trends toward alternative energy, and plummeting oil prices in 2020 created a cautious environment for increasing production. In 2022 the focus on maximizing profits led to record company profits with ExxonMobil reporting its highest quarterly earnings ever in the third quarter and Shell reporting its highest quarterly earnings ever in the second quarter. The International Energy Agency expects the net income for the world’s oil and natural gas producers to double in 2022 from 2021, to a record high of $4 trillion – quite a turnaround from two years ago.
In addition to global energy prices, the Russian invasion of Ukraine has had a significant impact on food prices. Global fertilizer prices rose to record levels in 2022. According to the USDA, fertilizer prices account for nearly one-fifth of U.S. farm cash costs, with an even greater share for corn and wheat producers. The Russian invasion of Ukraine triggered import-export restrictions that compounded supply problems. Russia is the top exporter of agricultural fertilizer with an estimated 15% of the global market.
The war has also had a major impact on the price of wheat. Russia and Ukraine combined for 30% of global wheat exports prior to the war. Wheat prices spiked 50% in early 2022, as wheat exports were disrupted by the war. Wheat prices significantly declined in summer aided by a United Nations brokered deal with Ukraine to establish a safe corridor for grain trade. Unfortunately, Russia backed out of that deal in late October. Significant uncertainty over wheat exports, and pricing, remains.
Inflation by Product Category
The table below shows price changes for selected products in October 2022 and over the past 12 months. Major product categories include Food, Energy, and all items less Food and Energy (which is also called “core inflation”). Subcategories include Food at Home, and four major products which had substantial price increases in the past 12 months under the “All Items less Food and Energy” category, including New Vehicles, Shelter, Medical Care Services, and Transportation.
| Product Category | Percent Price Change October 2022 | Percent Price Change 12-months Ended October 2022 |
| All Items | 0.4 | 7.7 |
| Food | 0.6 | 10.9 |
| Food at Home | 0.4 | 12.6 |
| Energy | 1.8 | 17.6 |
| All Items less Food and Energy | 0.3 | 6.3 |
| New Vehicles | 0.4 | 8.4 |
| Shelter | 0.8 | 6.9 |
| Medical Care Services | -0.6 | 5.4 |
| Transportation | 0.8 | 15.2 |
For the 12-months ended October 2022 overall inflation rose 7.7%, with core inflation (all items less food and energy) increasing 6.3%. Consistently over the past year, food and energy have been the leading categories of inflation. Food at Home increased 12.6%; one bright spot was that the October increase of 0.4% was the lowest monthly increase since December 2021. Energy prices rose 17.6% for the past 12 months. The October price increase of 1.8% followed three consecutive monthly price declines. New vehicle prices, Shelter, and Medical Care Services all had significant increases over the past year at 8.4%, 6.9%, and 5.4%, respectively. Only Medical Care Services saw a price decline in October. Transportation prices, reflecting increased energy costs, rose 15.2% over the past 12 months and 0.8% in October.
Wages and Profits
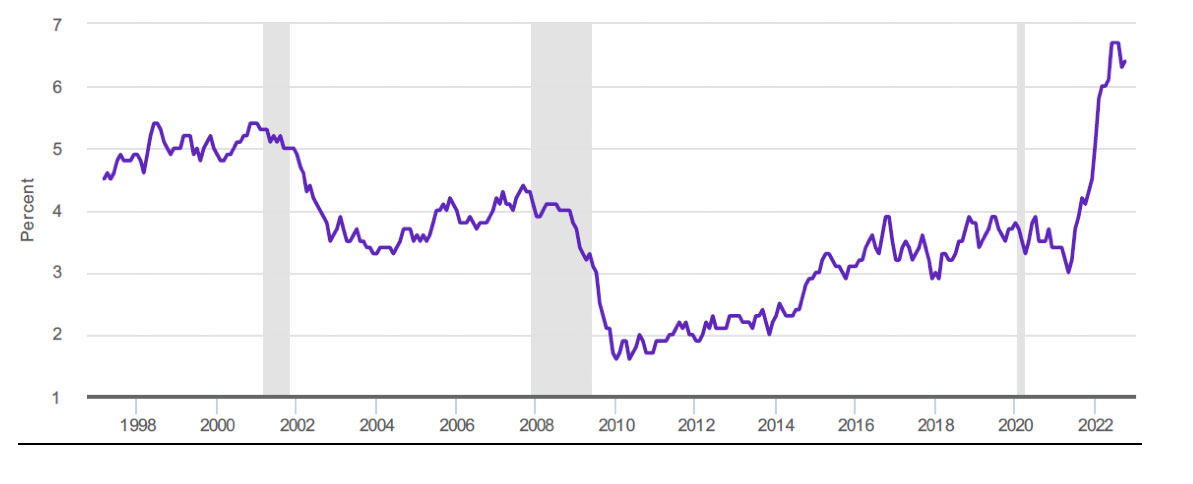
The Atlanta Fed’s Wage Growth Tracker is a measure of the nominal (unadjusted for inflation) wage growth of individuals. The graph below shows the 3-month moving average of median wage growth since 1998. Reflecting the strong labor market, wage growth increased significantly in late 2021 and 2022. Wage growth was 4.2% in September 2021, the highest growth since 2008. In 2022, wage growth peaked at 6.7%, declining slightly in October to 6.3%. Wage growth was higher between February 2022 and October 2022 than at any other time during the century. Although wage growth was at its highest point of the century, it still lagged inflation. as prices increased more than wages.
Wage Growth Tracker
3-Month Moving Average of Median Wage Growth, Hourly Data
Although the purchasing power of individuals and families has been declining, corporate profit margins have generally remained strong during the inflationary period, indicating that cost increases have largely been passed on to consumers.
According to FactSet, the net profit margin for the S&P 500 for the third quarter 2022 was 12.0%. Although profit margins have recently been declining, the third quarter of 2022 marks the seventh consecutive quarter in which the net profit margin was 12% or greater. Prior to 2021, the net profit margin had hit 12% in only one other quarter in the previous 10 years. The 5-year average for the net profit margin is 11.3%.
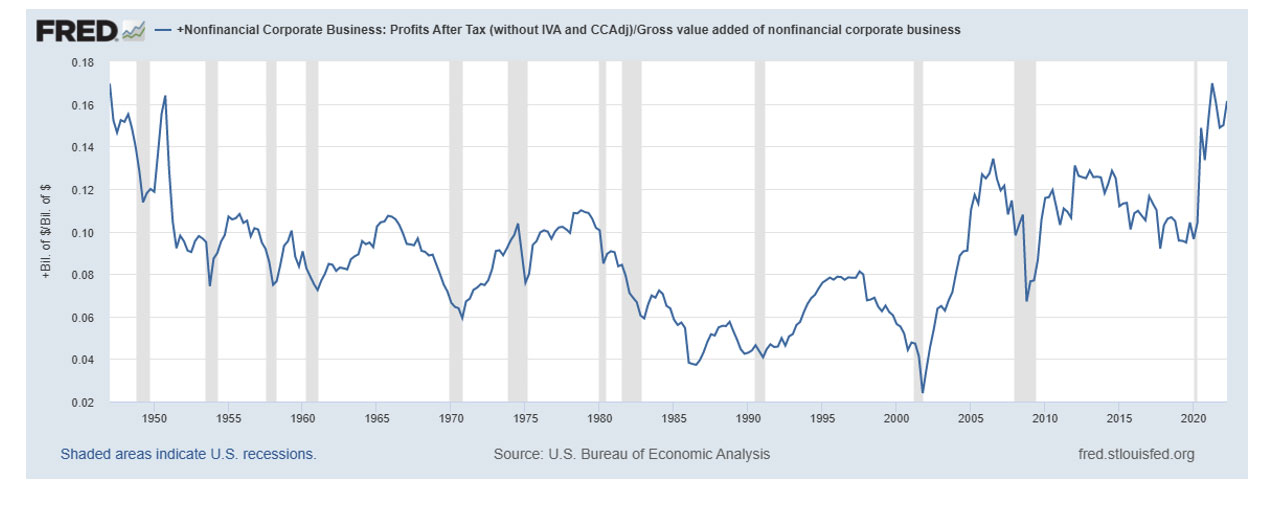
Another measure of U.S. corporate profit margins tracked by the Federal Reserve has recently been at levels not seen since the early1950s, indicating that the prices charged by businesses have exceeded their increased costs for production and labor. The graph below shows After-tax profits as a share of gross value added for non-financial corporations, a measure of aggregate profit margins. In both 2021 and 2022, aggregate profit margins approached 15% or higher, the highest level since the early 1950s.
Corporate Profit Margins
2023
Inflation and Interest Rates
Inflation is expected to gradually trend lower in 2023; the challenge will be to reduce not only the overall rate of inflation, but also the rate of inflation on those products that are not interest rate sensitive. As of September, the expectation by the Federal Reserve is that the annual rate of core inflation (all items less Food and Energy) will fall to approximately 3% in 2023. Rising interest rates will lower consumer and business spending, but uncertainty remains over inflationary contributing factors that the Federal Reserve cannot control, such as the impact of the Russia-Ukraine war on global food and energy prices.
Theoretically, the Federal Reserve acts in an independent manner to balance economic growth with inflation. The Federal Reserve tries to accomplish this goal through targeting the “fed funds rate” – a very short-term interest rate that when changed, typically has a rippling effect through the financial markets. The Federal Reserve influences this rate by primarily controlling the money supply in the United States. The amount of money circulating in the economy has an impact on interest rates and credit conditions – more money, lower interest rates; less money, higher interest rates. The federal funds rate is increased when the Federal Reserve decreases the money supply by selling Treasury securities (technically called Open Market Operations).
Increasing interest rates is the primary way the Federal Reserve fought inflation in 2022 and will continue to fight inflation in 2023. Central banks around the world, including the United States, Europe, the United Kingdom, and Canada, have all raised interest rates to combat inflation. The goal is to increase borrowing costs, which in turn lowers overall demand through reduced consumer and business spending, which in turn lowers the rate of inflation.
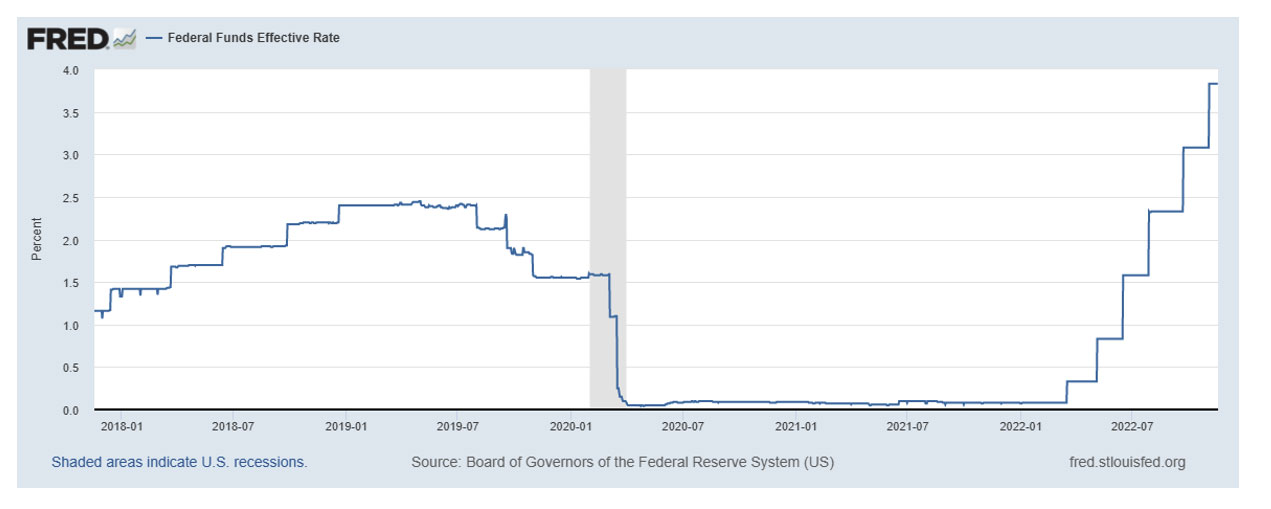
The federal funds rate started 2022 at a historical low of 0.00-0.25%; the federal funds rate will end the year at over 4%, which is a historically large increase in any given year. In March, the Federal Reserve began the upward trek for interest rates, including the unprecedented move of four consecutive 75 basis point increases in 2022. The expectation is for interest rates to peak in early to mid-2023 before declining. Increasing interest rates will reduce the overall rate of inflation as borrowing costs are increased, resulting in decreased consumer and business demand. The chart below shows the daily federal funds effective (market) rate since January 2018.
Federal Funds Effective Rate
However, the demand for some of the main product categories with high inflation are not interest rate sensitive. Food and medical care services saw significant price increases for the 12 months ended in October. Various factors contributed to the increase, but the low level of interest rates wasn’t one of them. The Russia-Ukraine war has had a significant impact on increasing food prices, contributing to record level global fertilizer prices and a spike in commodity prices in 2022. The war also played a significant role in energy prices, causing oil prices to jump which in turn increases transportation prices and shipping costs. Supply chain issues contributed to the price of new cars rising significantly due to the shortage of semiconductors. Between April 2021 and July 2022, new vehicle prices increased nearly 16%. Over that same period, vehicle sales declined by over 26% from 18.8 million to 13.8 million. New vehicle sales in July 2022 were lower than at any time between January 2012 and February 2020, before the impact of COVID on the economy. The problem was supply, not demand.
Although the overall level of inflation should gradually decrease in 2023, there are factors not related to interest rates that affect the demand for specific products and their pricing. Hopefully the war in Ukraine can be peacefully resolved, supply chains continue to improve, and energy prices decline or least stabilize.
Economic Growth
Economic growth in 2023 is expected to be relatively weak as increasing interest rates slow the economy to reduce inflation. As of September, the Federal Reserve expected annual economic growth of approximately 1.2% for 2023 before accelerating in 2024. The main question will be if a recession can be avoided. Factors outside the control of the Federal Reserve, such as the war in Ukraine, energy prices, and supply chain issues, increase the uncertainty as to whether a recession can be avoided. However, if a recession does occur, the general expectation is that it will be relatively short-lived with a minor economic contraction.
There are differing opinions as to whether the Federal Reserve started increasing interest rates too late, and differing opinions as to whether the Federal Reserve will increase interest rates too much. The primary objective right now for the Federal Reserve is to lower inflation, but the hope is that interest rates will not be raised too high, which would consequently contribute to the economy slipping into recession.
What has been driving economic growth? To answer that question, the table below shows how changes in the four components of GDP contributed to the change in U.S. economic growth since 2020.
Personal consumption accounts for approximately two-thirds of GDP, and personal consumption has been the key, consistent, driver of economic growth during the economic recovery, contributing positively to GDP growth since the third quarter of 2020. Despite the economic slowdown in the first half of the year, personal consumption contributed to GDP growth in each of the first three quarters in 2022. Increasing personal consumption contributed to economic growth for nine straight quarters, beginning with the third quarter of 2020 and continuing through the third quarter of 2022.
Contributions to Percent Change in Real Gross Domestic Product–Annualized Rate
| 2020 Q1 | 2020 Q2 | 2020 Q3 | 2020 Q4 | |
| GDP | -4.6 | -29.9 | 35.3 | 3.9 |
| Personal Consumption | -4.25 | -23.07 | 26.34 | 2.53 |
| Investment | -0.88 | -9.65 | 12.69 | 3.07 |
| Government Spending | 0.57 | 1.57 | -0.97 | -0.01 |
| Net Exports | -0.05 | 1.30 | -2.74 | -1.68 |
| 2021 Q1 | 2021 Q2 | 2021 Q3 | 2021 Q4 | |
| GDP | 6.3 | 7.0 | 2.7 | 7.0 |
| Personal Consumption | 6.98 | 7.84 | 1.98 | 2.14 |
| Investment | -0.82 | 0.30 | 1.78 | 5.14 |
| Government Spending | 1.18 | -0.54 | -0.02 | -0.16 |
| Net Exports | -1.02 | -0.60 | -1.08 | -0.16 |
| 2022 Q1 | 2022 Q2 | 2022 Q3 | ||
| GDP | -1.6 | -0.6 | 2.6 | |
| Personal Consumption | 0.91 | 1.38 | 0.97 | |
| Investment | 0.98 | -2.83 | -1.59 | |
| Government Spending | -0.40 | -0.29 | 0.42 | |
| Net Exports | -3.13 | 1.16 | 2.77 |
As the Federal Reserve increased interest rates in 2022, the rate of growth of personal consumption declined relative to 2021 growth rates, but growth remained positive through 2022. The increasing interest rates contributed to significant declines in investment spending, including residential investment, for both the second and third quarters of 2022. Investment spending had contributed to an increase in economic growth for four consecutive quarters prior to the second quarter decline in 2022.
Currently, the primary objective for the Federal Reserve is to lower inflation, even at the expense of economic growth. Given that objective, expect weak economic growth at best in 2023. Rising interest rates should temper both personal consumption and investment spending, at the expense of economic growth.
Employment
The unemployment rate will likely increase in 2023 as weak economic growth (at best) results from rising interest rates. As of September, the Federal Reserve expected the 2023 unemployment rate to increase to approximately 4.5%. There will be a strong emphasis by the Federal Reserve to cool down the labor market as a key component of reducing inflation.
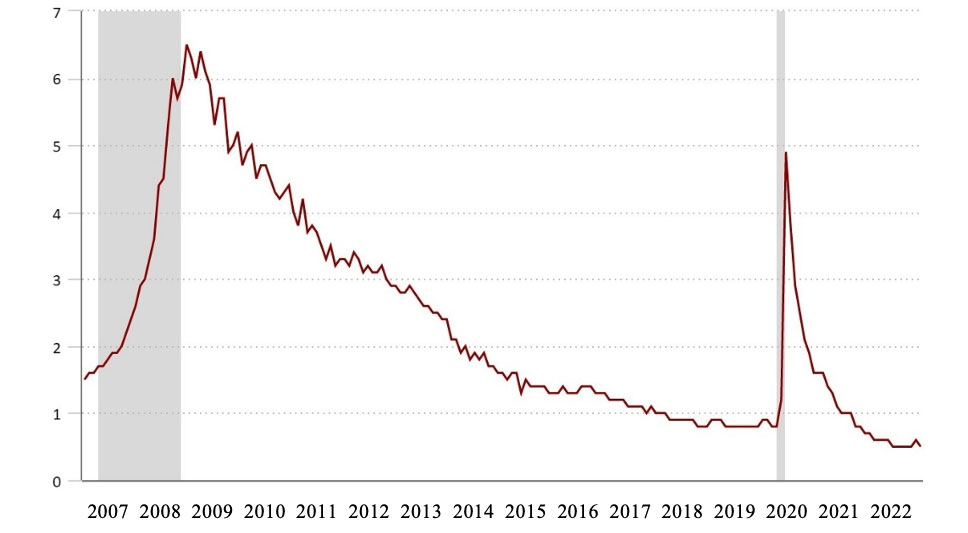
The strong consumer spending since the second quarter of 2020 reflects the strong labor market. Implicit in the Federal Reserve’s objective to lower inflation is to cool the hot labor market. The chart below shows the number of unemployed workers per job opening since 2007. The number of unemployed workers to job openings has been less than one since June 2021, lower than at any other time this century. In other words, there were approximately two job openings for every one person unemployed. “Labor shortages” appeared in many industries, leading to a relatively strong increase in wages in both 2021 and 2022. In 2022 the three-month moving average of median wage growth was at its highest levels of the century at over 6% between February and October.
Number of Unemployed Persons per Job Opening
The strong labor market and rising wages are a key concern expressed by the Federal Reserve, as wage growth can contribute to strong consumer demand, which in turn can contribute to inflation. Ideally, wage growth occurs without inflation; however, recent wage growth has been outpaced by inflation. A primary focus in 2023 by the Federal Reserve will be to reduce wage growth by balancing the number of unemployed persons with job openings. Wage growth in 2023 should be tempered by growing unemployment and a cooling labor market that result from weak economic growth.
Summary
In 2022 inflation was a global problem, ranging from 7-10% in the Euro area, United Kingdom, Canada, and the United States. Inflation was driven by global factors, including the effects of the Russia-Ukraine war and its impact on food and energy prices.
Central banks around the world, including the United States Federal Reserve, began increasing interest rates to raise borrowing costs and consequently lower consumer and business demand. Over the years, a 2% inflation target has become an international standard across central banks around the globe, including the Federal Reserve. Global interest rates will likely increase until decreasing inflation makes the 2% target seem achievable. As of September, the expectation by the Federal Reserve is that core inflation will fall to approximately 3% in 2023. However, like most forecasts, it is subject to change and error, especially since there are global factors outside the control of the Federal Reserve that will impact inflation.
As a result of rising interest rates, 2023 is projected to be a relatively weak year at best for economic growth, with the Federal Reserve predicting growth of only around 1%. There remain concerns over a possible recession, partially because of concerns that the Federal Reserve began raising interest lates too late or may raise them too much. However, if a recession does occur, the general expectation is that it will be relatively short-lived with a minor economic contraction. The number one issue for the Federal Reserve is to lower inflation and increasing interest rates is the primary way that the Federal Reserve can battle inflation. There is generally an inverse relationship between interest rates and economic growth. Interest rates will be increased until the long-range inflationary target of 2% once again seems achievable. The increased interest rates should lower consumer and business spending, resulting in weak economic growth. The Federal Reserve not only wants to lower inflation, but also inflationary expectations. The federal funds rate is expected to be around 5% in early 2023, with subsequent increases or decreases subject to changes in the rate of inflation.
Slowing economic growth should cool the labor market, reflected by an increasing unemployment rate, lower wage increases, and fewer job openings. The Federal Reserve expected the 2023 unemployment rate to increase to approximately 4.5% from the October 2022 rate of 3.7%.
A little historical perspective can help provide context for understanding 2023. If unemployment rises from sub 4.0% levels in 2022 to 5% in 2023, that will equate to the unemployment rate in September 2016 when the U.S. was in the midst of its longest economic expansion. The federal funds rate is expected to be approximately 5% in early 2023, which would equate to rates that prevailed in 2006. In 2022, the annualized inflation of 9.1% in June was the highest inflation since 1981, before falling in October to 7.7%. If inflation could be reduced to 5% in 2023, that would put inflation approximately equal to the inflation rate in 1990; a decrease to 4% would approximately equal the 2008 rate. 2023 economic growth of 1% would match economic growth in 2001; growth of 1.5% would match economic growth in 2011.
2023 will see a continued battle against global inflation with the Federal Reserve likely to continue raising interest rates. Weak economic growth would also place downward pressure on energy prices through lower demand. Global interest rates will likely increase until a global 2% inflation rate target seems achievable. However, interest rates alone do not determine the level of inflation. Global unknowns remain, such as the effects of the Russia-Ukraine war on food and energy markets and lingering supply chain issues. Although weak economic growth or even a recession may occur in 2023, the Federal Reserve expects economic growth to rebound in 2024 as markets stabilize and inflationary expectations recede.
For further information:
- Info from the Bureau of Labor Statistics:
- From the World Bank:
- GDP Growth (and other national data) from the Bureau of Economic Analysis:
- From Eurostat:
- From the Bank of Canada:
- Global Inflation, from rateinflation.com
- From the U.S. Energy Information Administration:
- From Europa, an official website of the European Union, statistics on European energy:
- From the International Energy Administration:
- From FactSet:
- From the Atlanta Federal Reserve:
- From the Federal Reserve:

Kevin Bahr is a professor emeritus of finance and chief analyst of the Center for Business and Economic Insight in the Sentry School of Business and Economics at the University of Wisconsin-Stevens Point.