
Recently there has been a lot of buzz about implementing a form of flat tax, a 30% national sales tax, to replace the current tax structure. This blog provides a simple (yet realistic) example to demonstrate the implications for taxpayers if the currently proposed federal national sales tax of 30% was implemented. Prior to the example, a quick, general overview of current tax law and the proposed national sales (flat) tax is provided. For simplicity and clarity, the example will focus on a single taxpayer, but the implications of the flat tax are similar for married taxpayers.
Current Law
The current federal income tax structure is a progressive tax structure. Although there were changes in the tax law due to the Tax Act of 2018, the basic structure remains the same. Theoretically, the more you make, the more you pay. Your taxable income, your filing status (for example, single, married, married filing separately), and any tax credits determine what you owe in taxes. Your taxable income is determined as follows:
| Gross Income | |
|---|---|
| Less: | Certain Adjustments |
| Less: | Less: Deductions |
| Equals: | Taxable Income |
Examples of adjustments that reduce taxable income include contributions to a traditional Individual Retirement Account and student loan interest (other items are listed on Form 1040). Everyone gets the “standard deduction” amount unless the amount for allowable itemized deductions is greater. However, fewer taxpayers itemize following the Tax Act of 2018 as itemized deduction amounts were limited and the standard deduction amount basically doubled. (According to smartasset.com, approximately 90 percent of taxpayers take the standard deduction, with upper income taxpayers more likely to itemize.) For the 2022 tax year, the standard deduction amount is generally $12,950 for individual taxpayers and $25,900 for married filing jointly. Allowable (amounts are limited) itemized deductions include mortgage interest, state taxes, medical expenses. and charitable deductions.
There are progressively higher tax rates that apply to increasingly higher taxable income levels. As your taxable income increases, higher tax rates will apply as you reach a higher income bracket. The 2022 tax rates and brackets for single taxpayers are shown below.
| 2022 Tax Rates and Tax Brackets (Single Taxpayer) | |
|---|---|
| 10% | $0 to $10,275 |
| 12% | $10,276 to $41,775 |
| 22% | $41,776 to $89,075 |
| 24% | $89,076 to $170,050 |
| 32% | $170,051 to $215,950 |
| 35% | $215,951 to $539,900 |
| 37% | $539,901 or more |
The rates apply to the taxable income in a given bracket. For example, if you are single, you pay a 10% rate on taxable income up to $10,275. Income over $10,275 is taxed at a 12% rate up to $41,775 in 2022. So, if your taxable income was $37,950, your tax liability is .10($10,275) + .12($37,950 – $10,275) = $4,348.50. Your tax liability (taxes owed) may be reduced by certain tax credits (such as the Child Tax Credit).
The National Sales Tax
In early January, the “Fair Tax Act” was introduced in the House of Representatives. The concept is not new; the “Fair Tax” has periodically been proposed for several decades. The current proposal is for a national sales tax at a 23% flat rate, but that rate is “tax-inclusive,” meaning the percentage you pay is calculated based on the total price of your purchase. In everyday practice, the national sales tax rate under the proposed Fair Tax Act would effectively be 30%. For example, if you bought $100 worth of goods at a store, you would pay $30 in sales tax, for a total of $130. The “tax-inclusive” method of calculating the rate is that $30 of $130 is 23%; but effectively, you are paying 30%. The national sales tax would replace the individual income tax, corporate income tax, estate and gift taxes, and payroll tax. The 23% sales tax is a retail tax that applies to purchases of new goods and services; used goods and business-to-business purchases are not taxed.
Proponents of the national sales tax argue that the flat tax would simplify taxes. Of course, taxes could be simplified without switching to a national sales tax. Proponents also argue that the national sales tax could eventually eliminate the Internal Revenue Service. However, the administration of taxes would essentially be shifted to states and the Social Security Administration. The current proposal abolishes the IRS by requiring state agencies to collect taxes in the form of a flat 23 percent consumption tax and forward the revenues to the U.S. Treasury. Initially, businesses would be collecting the 23% retail tax.
The national sales tax revenue would not only replace current income taxes, it would also replace Social Security payroll taxes. A disadvantage for retirees is that they will continue to fund Social Security after retirement through the national sales tax. Under current law, funding of Social Security through payroll taxes ceases with retirement.
While all consumers would pay the same effective 30% sales tax rate, the current proposal provides for a monthly tax rebate payment, based on the poverty rate and family size. Households would receive a monthly “prebate” that would be equal to one-twelfth of 23% of the monthly cost of living at the federal poverty level. (It is called a “prebate” because it is meant to be a payment for household necessities prior to their purchase.) For example, in 2022 the poverty level for a one-person household was $13,590. The monthly prebate would have been approximately $260. The goal is to help offset the tax levy on low-income Americans who tend to spend a higher proportion of their paycheck on goods and services and eliminate the taxation of household necessities. The administration of rebate checks would be administered by the Social Security Administration. In effect, the tax administration of the IRS is replaced by states and the Social Security Administration.
An Example – The Effective Tax Rate: Current Law vs. National Sales (Fixed) Tax
Table 1 below shows the total taxes and effective tax rate given current tax laws for six different individual income levels ranging from $25,000 to $1,000,000 (column A). To provide comparability, the standard deduction (column B) is taken at each income level to determine taxable income. Taxable income (column C) is calculated by subtracting the standard deduction from the gross income level. Federal income taxes (column D) are calculated based on the tax rates that apply to the specific tax brackets (as discussed earlier) given the taxable income level. Total taxes (column G) include federal income taxes (column D), Social Security taxes (column E), and Medicare taxes (column F). The Social Security tax rate is 6.2% on income up to a cap of $147,000 in 2022; Social Security taxes are not paid on income exceeding the cap. The Medicare tax rate is 1.45% of income. There is no income cap for Medicare taxes. The effective tax rates (column H) on gross income are total taxes divided by gross income.
Table 1 – Total Taxes and Effective Tax Rate Under Current Law for Six Individual Income Levels
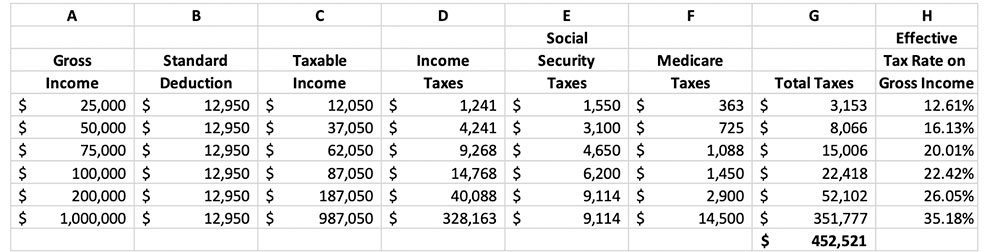
Table 1 indicates that both total taxes and the effective tax rate on gross income increase for each income level under current law. Total taxes are $3,153 for an individual with gross income of $25,000 and increase at each income level, peaking at $351,777 for an individual with gross income of $1 million. The current federal income tax structure is a progressive tax structure with progressively higher tax rates that apply to increasingly higher taxable income levels. This is reflected by the increasing level of income taxes (column D) as taxable income (column C) increases. Social security taxes (6.2% tax rate) increase as gross income increases up to a salary limit of $147,000, the cap for Social Security taxes in 2022. Medicare taxes increase with gross income given a flat 1.45% tax rate applies with no salary limit. The effective tax rate increases at each income level, from a low of 12.61% for an individual with gross income of $25,000 up to 35.18% for an individual with gross income of $1 million. Total taxes collected by the federal government are $452,521.
Table 2 below shows the total taxes and effective tax rate given a 30% national sales (flat) tax for the same six individual income levels ranging from $25,000 to $1,000,000 (column A). To provide comparability, a savings rate of 3% is assumed at each income level to determine total savings (column B). A personal consumption rate of 97% is assumed at each income level to determine personal consumption expenditures (column C). The sales tax (column E) is calculated by multiplying personal consumption times the 30% national sales tax rate. The individual prebate (column F) is 23% of the national poverty level for an individual (as discussed earlier). Total taxes (column G) at each income level are the sales taxes minus the prebate. The effective tax rates (column H) on gross income are total taxes divided by gross income.
Table 2 – Total Taxes and Effective Tax Rate with 30% Sales Tax for Six Individual Income Levels
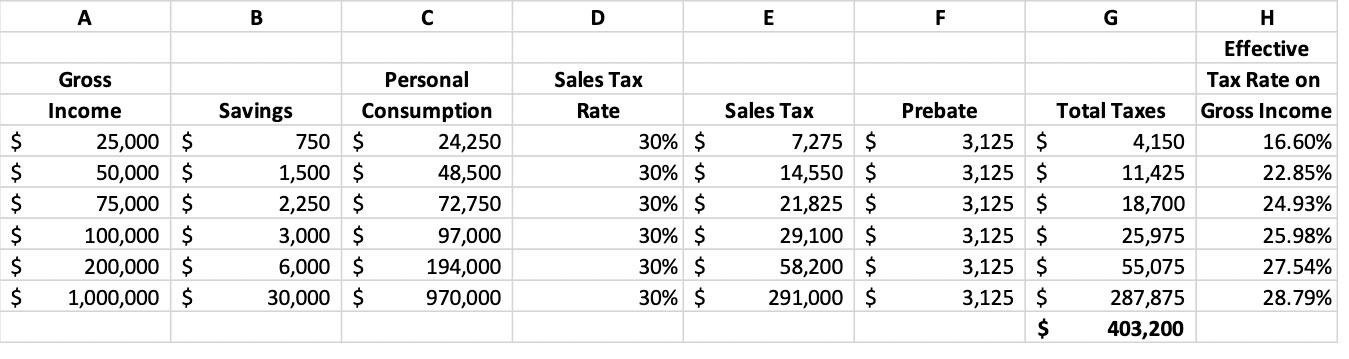
Table 2 indicates that both total taxes and the effective tax rate on gross income increase for each income level with a 30% national sales tax. Total taxes are $4,150 for an individual with gross income of $25,000 and increase at each income level, peaking at $287,875 for an individual with gross income of $1 million. The effective tax rate increases at each income level, from a low of 16.60% for an individual with gross income of $25,000 up to 28.79% for an individual with gross income of $1 million. Total taxes collected by the federal government are $403,200.
Table 3 provides a summary of the total taxes and effective tax rates under current tax law and a 30% national sales tax for each of the six income levels (column A). The total taxes paid at each income level under current law (column B) is compared to the total taxes paid under the 30% sales tax (column C), with the change in taxes indicated for each income level (column D). The effective tax rate on gross income at each income level under current law (column E) is compared to the effective tax rate on gross income under the 30% national sales tax (column F), with the change in the effective tax rate indicated for each income level (column G).
Table 3 – Total Taxes and Tax Rate Comparison: Current Law vs. 30% National Sales Tax

For five out of six income levels, the change in the amount of taxes paid increases. The increase in taxes ranges from $997 for gross income of $25,000 to an increase of $3,695 for gross income of $75,000. Although taxes increase for gross incomes of $100,000 and $200,000, note that the amount of increase begins to decline after $75,000. Taxes declined for only one level of gross income – the highest level. Taxes declined $63,902 for gross income of $1 million.
The effective tax rate increases as the level of income increases under both current law and a 30% national sales tax. However, the effective tax rate is higher for the bottom five income levels with the implementation of a 30% sales tax. The increase in the effective tax rate ranges from 1.49% for gross income of $200,000 to 6.72% for gross income of $50,000. The amount of increase in the effective tax rate declines beginning with the gross income level of $75,000. Only at the highest gross income, $1 million, did the effective tax rate decline with a 6.39% decrease.
In this example, note that the total taxes collected by the federal government would be significantly less under the 30% national sales tax. Under current law, total taxes are $452,521. Under the 30% national sales tax, total taxes are $403,200. Business taxes would also be reduced. One of the challenges of implementing a national sales tax would be to keep tax revenues at approximately the same amount. The national sales tax would have to replace not only revenue collected from the individual income tax, but also corporate income taxes, estate and gift taxes, and payroll taxes. If tax revenues decrease, the federal government would be faced with the following options: 1) increasing the budget deficit (and potentially the debt ceiling), 2) decreasing government spending and specifying programs and services where expenditures will be reduced, or 3) increasing the national sales tax.
Summary
The Fair Tax concept replaces the individual income tax, corporate income tax, estate and gift taxes, and payroll tax with a 30% national sales tax. Proponents argue that advantages of the national sales tax include simplifying taxes and eliminating the IRS. Taxes would be simplified, but unfortunately lower to middle income taxpayers would generally pay greater taxes while upper income taxpayers would generally pay lower taxes. In addition, despite paying taxes to fund Social Security throughout their working lives, retirees will continue to pay taxes to fund Social Security with a national sales tax. There are also questions regarding tax evasion and how the proper application of a sales tax on appropriate retail goods and services would be enforced.
The IRS could potentially be eliminated, but new administrative challenges arise for enforcing, collecting, and remitting a national sales tax to the federal government for state agencies and businesses. In addition, the Social Security Administration would incur significantly greater costs through its responsibility to distribute monthly prebate checks to every American household.
Tax simplification could occur without implementation of a national sales tax. However, any change in tax policy that keeps tax revenues constant will result in a change in who pays the taxes. Any change in tax policy that reduces tax revenues will result in decisions regarding what government programs and services are cut, increasing government budget deficits, or future tax increases. Like most things in life, there is a cost for everything, even tax reform. The key question – how the distribution of tax payments changes between taxpayers after any tax reform.
For further information:
- From the Tax Foundation: Fair Tax FAQ
- From CNBC: The Fair Tax Act
- From the Brookings Institution: Don’t Buy the Sales Tax
- From smartasset.com: Itemized Deductions – 2021 Study

Kevin Bahr is a professor emeritus of finance and chief analyst of the Center for Business and Economic Insight in the Sentry School of Business and Economics at the University of Wisconsin-Stevens Point.