
Overview
2023 began with much speculation about the economy. Would there be a recession? Would economic growth continue leading to a soft landing? The Federal Reserve began raising interest rates in 2022 to reduce consumer and business spending to combat inflation. The Federal Reserve tries to accomplish this goal through targeting the “federal (fed) funds rate” – the overnight borrowing rate between banks. The Federal Reserve influences this rate by primarily controlling the money supply in the United States. The amount of money circulating in the economy has an impact on interest rates and credit conditions – more money, lower interest rates; less money, higher interest rates. The federal funds rate is increased when the Federal Reserve decreases the money supply by selling Treasury securities (technically called Open Market Operations).
The federal funds rate started 2022 at a historical low of 0.00-0.25%. In March, the Federal Reserve began the upward trek for interest rates, including the unprecedented move of four consecutive 75 basis point increases in 2022. A total of seven interest rate increases were implemented in 2022, bringing the federal funds rate to 4.25-4.50% by year-end. In February 2023, the federal funds rate increased to 4.50-4.75% with another 25 basis point increase by the Federal Reserve. Another interest rate increase is likely in late March. The rate increases not only tempered economic growth and inflation, but they also had an important and significant impact on the housing market. This blog will take a closer look at the housing market, and the link between the housing market and interest rates.
The Federal Funds Rate and Mortgage Rates – Long Term
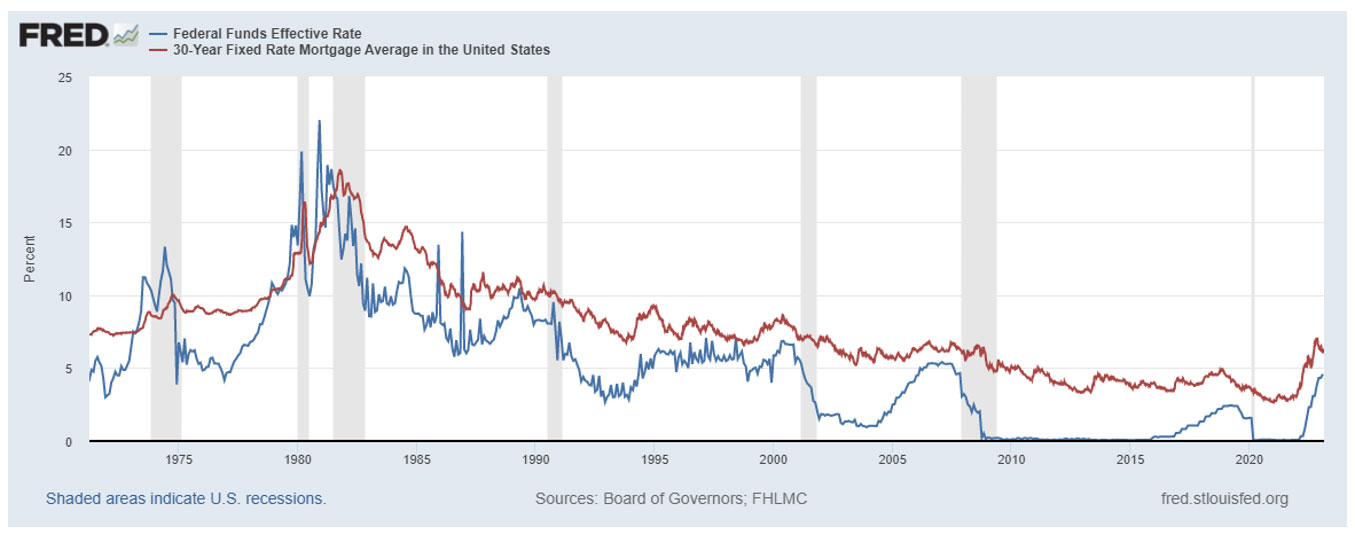
The federal funds rate is a very short-term interest rate that when changed, typically has a rippling effect through the financial markets, including mortgage rates. The chart below shows the federal funds rate (blue line) and the 30-year fixed rate mortgage average in the United States (red line) since 1971. Generally, the trends in changes in the federal funds rate and the 30-year fixed rate mortgage average are similar. Increases in the federal funds rate generally increase mortgage rates and decreases in the federal funds rate generally decrease mortgage rates. However, the magnitude of the change in the federal funds rate can differ from the magnitude of the change in mortgage rates. For example, between June 2004 and June 2006 the federal funds rate increased approximately 4%, yet the 30-year fixed rate mortgage average increased by approximately only 0.5%.
While the Federal Reserve targets the federal funds rate, mortgage rates are also affected by other factors such as the demand and supply of houses, economic conditions (including economic growth, employment, and inflation), credit conditions, and the bond market (the ability for lenders to sell mortgages though mortgage-backed securities). As a result, the trends are similar between changes in the federal funds rate and changes in mortgage rates, but the magnitude of the changes will be different.
Federal Funds Effective Rate and 30-Year Fixed Rate Mortgage Average: 1971 – Feb. 2023
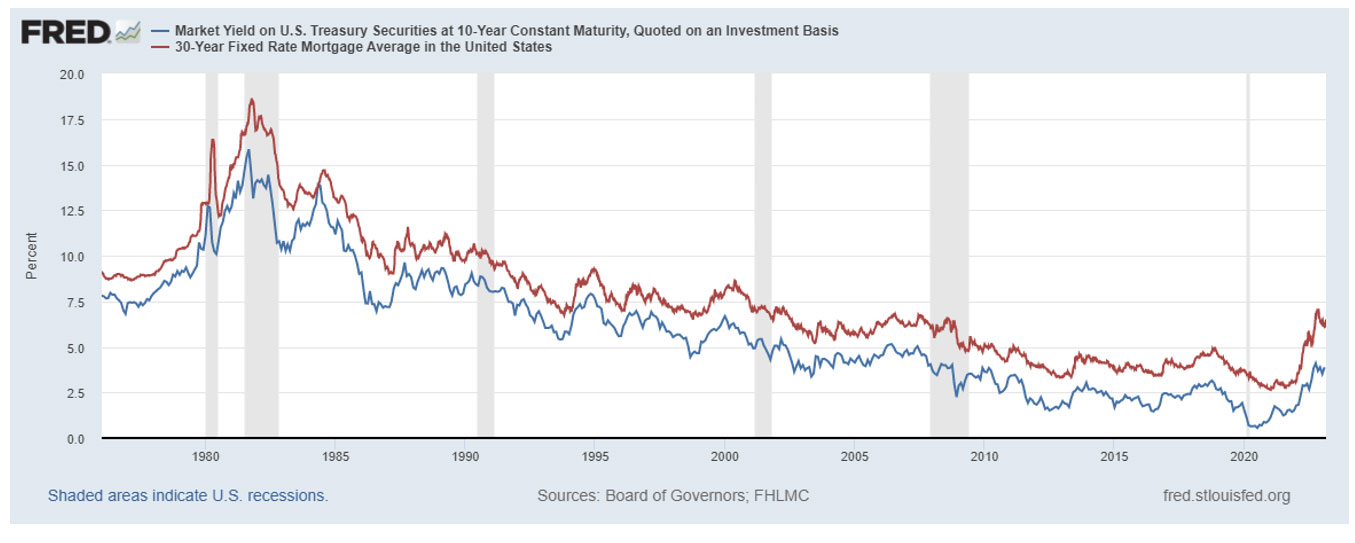
When the federal funds rate is changed there is typically a rippling effect through the financial markets. The interest rate on long-term U.S. Treasury securities is a benchmark rate for borrowing in the financial markets. United States Treasury securities, often simply called Treasuries, are debt obligations issued by the United States Government and secured by the full faith and credit (the power to tax and borrow) of the United States. As a result, Treasuries are generally viewed as lower risk securities than other types of borrowing. The chart below shows the relationship between the yield on 10-year Treasury securities (blue line) and the 30-year fixed rate mortgage average in the United States (red line) from 1976 through February 2023. Movements in the 30-year fixed rate mortgage average are closely aligned with movements in the yield on 10-year Treasury securities.
Market Yield on U.S. Treasury Securities with 10-Year Maturity vs. 30-Year Fixed Rate Mortgage Average: 1971 – Feb. 2023
The Federal Funds Rate and Mortgage Rates – Short Term
To focus more on what has been happening in the housing market recently, the chart below shows the federal funds rate (blue line) and the 30-year fixed rate mortgage average in the United States (red line) since January 2020. The 30-year fixed rate mortgage average bottomed out in January 2021 at 2.65% before increasing slightly as the economy recovered and ended the year at 3.11% in December. As the Federal Reserve began increasing interest rates in early 2022, mortgage rates generally moved in tandem with the increases, peaking at 7.08% in late October. The 30-year fixed rate mortgage average more than doubled between December 2021 and October 2022. However, mortgage rates have declined slightly from their peak due to economic growth concerns, a cooling housing market, and decreasing inflation. In February 2023, the 30-year year fixed rate mortgage average was at 6.32%.
Federal Funds Effective Rate and 30-Year Fixed Rate Mortgage Average: 2020 – Feb. 2023

The Monthly Cost of Mortgage Rate Increases
The monthly mortgage payment on a 30-year fixed rate mortgage has increased significantly relative to what it was in 2021. After bottoming out at 2.65% in January 2021, the 30-year fixed rate mortgage average generally hovered around 3% for most of the year. In 2022, the 30-year fixed rate mortgage average gradually increased and peaked at 7.08% in October 2022 before declining slightly. Changes in mortgage rates can have a significant impact on the cost of mortgages and consequently the monthly mortgage payment and the demand for housing.
The table below shows the effect of increasing mortgage rates on monthly mortgage payments for a 30-year fixed mortgage. The monthly mortgage payment is given for five different mortgage rate levels ranging from 3% to 7% and four different mortgage amounts: $100,000, $200,000, $300,000, and $400,000. Note the mortgage rates in the table generally reflect what happened in the U.S. housing market recently; interest rates were around 3% for most of 2021 but increased in 2022 before peaking at approximately 7% in October. Increasing mortgage rates can significantly increase the monthly mortgage payment. For example, the monthly mortgage payment on a $100,000 30-year fixed rate mortgage increases from $421.60 at a rate of 3% to $665.30 at a rate of 7%. As the chart below indicates, a mortgage with a rate of 7% would result in a monthly payment that is over 50% greater than the monthly payment on a mortgage with a rate of 3%.
30-Year Fixed Rate Mortgage Monthly Payment at Mortgage Rates of 3% through 7%
| Mortgage Amount | 3% | 4% | 5% | 6% | 7% |
|---|---|---|---|---|---|
| $100,000 | $421.60 | $477.42 | $536.82 | $599.55 | $665.30 |
| $200,000 | $843.21 | $954.83 | $1,073.64 | $1,199.10 | $1,330.60 |
| $300,000 | $1,264.81 | $1,432.25 | $1,610.46 | $1,798.65 | $1,995.91 |
| $400,000 | $1,686.42 | $1,909.66 | $2,147.29 | $2,398.20 | $2,661.21 |
Housing Sales
Not surprisingly, the rising mortgage rates hit home sales hard in 2022. According to the National Association of Realtors (NAR), national sales of previously owned homes fell 0.7% in January 2023, the 12th straight month that housing sales decreased. Home sales fell to a seasonally adjusted annual rate of 4 million, the lowest rate since October 2010. According to the NAR, the January 2023 decline marked the longest streak of back-to-back monthly declines on record since 1999. January 2023 home sales were down 36.9% from a year earlier. Rising mortgage rates caused a drop in affordability as monthly mortgage payments ramped up. Combined with economic uncertainty, many potential buyers left the market, at least temporarily.
According to the Wisconsin Realtors Association, trends in Wisconsin home sales in 2022 were similar to what was happening nationally. Home sales dropped to 78,143 in 2022, a 14.6% decline from 2021. Wisconsin home sales in 2022 were at their lowest level since 2014.
Housing Prices
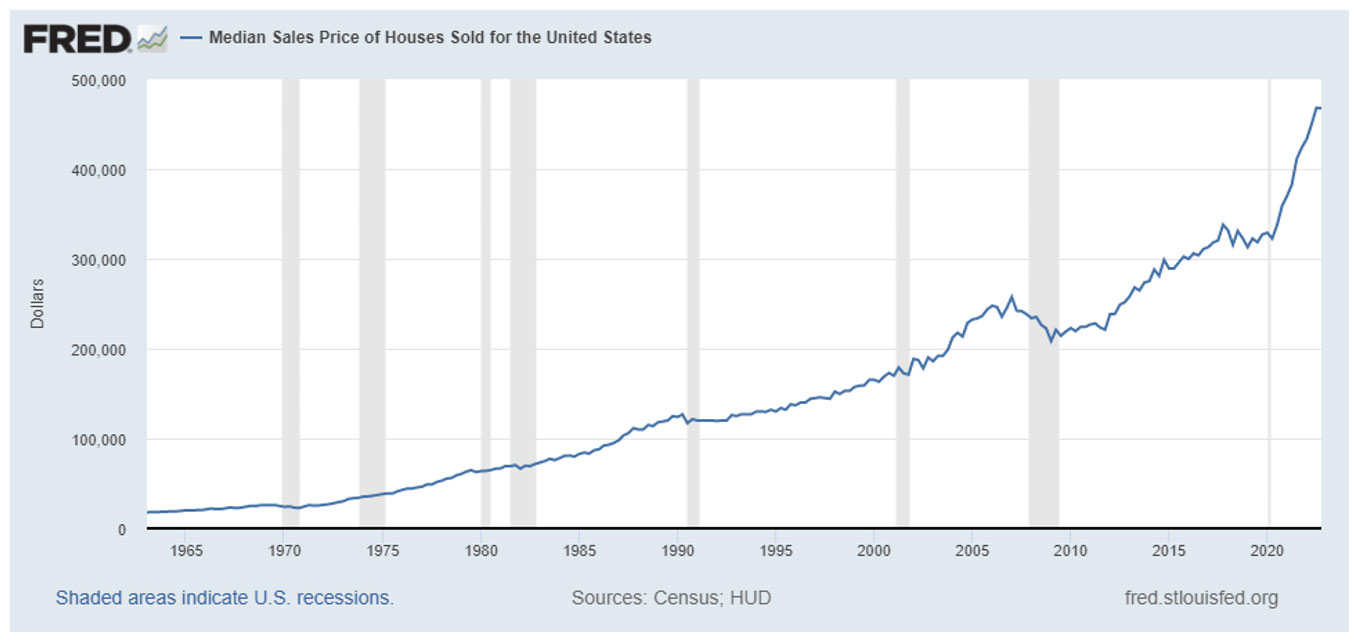
Generally, housing prices gradually and consistently increase in the long run. The graph below shows the quarterly median sales price of houses sold in the U.S. from 1963 through the third quarter of 2022. Housing prices generally increase, although exceptions have occurred. A slight dip in prices occurred during the recessions of 1982 and 1991 and the economic slowdown of 2019. Most notably, prices declined significantly during the financial crisis of 2008.
Although housing prices generally increase, beginning in 2020 and continuing through the middle of 2022 the rate of price increases was historically high. Note the steepness of the curve beginning in 2020. Between the first quarter of 2020 through the middle of 2022, the quarterly median sales price increased approximately 42%. The percentage increase in prices over those 10 quarters nearly matches the percentage increase that occurred over the entire last decade. Between the first quarter of 2010 and the fourth quarter of 2019, the quarterly median sales price increased approximately 47%.
Quarterly Median Sales Price of Houses Sold in the United States, 1963 – 2022 3rd qtr.
Rising mortgage rates began to impact housing prices in the second half of 2022. According to the National Association of Realtors (NAR), after reaching a high of $413,800 in June 2022, the national median existing-home sales price fell in January 2023 for the seventh straight month. However, prices increased compared to the prior year. The national median existing-home sales price in the U.S. was $359,000 in January 2023, an increase of 1.3% compared to January 2022. According to the Wisconsin Realtors Association, trends in Wisconsin home prices were similar to national trends. After peaking at $280,000 in June 2022, home prices decreased each month for the remainder of the year. The Wisconsin median home sales price declined to $250,000 in December 2022. The December 2022 median sales price was 5.5% higher than the December 2021 median sales price of $237,000.
Summary
As the economy began to recover in 2020, the housing market boomed, and housing prices began an unprecedented climb. Between the first quarter of 2020 through the middle of 2022, the median home sales price increased approximately 42%, nearly matching the 47% increase that occurred over the entire last decade. The price increase in the first 10 quarters of the current decade nearly matched the 10-year price increase of the last decade.
The Federal Reserve began raising interest rates in 2022 to reduce consumer and business spending to combat inflation. A total of seven interest rate increases were implemented in 2022, bringing the federal funds rate to 4.25-4.50% by year-end after starting the year at a historical low of 0.00-0.25%. In February 2023, the federal funds rate increased to 4.50-4.75% with another 25 basis point increase by the Federal Reserve. The increasing federal funds rate impacted the housing market through increased mortgage rates resulting in significantly higher monthly mortgage payments. After bottoming out at 2.65% in January 2021, the 30-year fixed rate mortgage average generally hovered around 3% for most of the year. In 2022, the 30-year fixed rate mortgage average more than doubled, peaking at 7.08% in October 2022 before declining slightly. The increasing rates, combined with growing economic uncertainty, put an end to the housing boom. Home sales and prices declined.
According to the National Association of Realtors, national sales of previously owned homes fell 0.7% in January 2023, the 12th straight month that housing sales decreased. Home sales fell to their lowest rate since October 2010. January 2023 home sales were down 36.9% from a year earlier. The rising mortgage rate and economic uncertainty put a damper on what had been an extremely hot housing market for sellers. After reaching a high of $413,800 in June 2022, the national median existing-home sales price fell in January 2023 to $359,000. It was the seventh straight monthly decline for housing prices, although the January 2023 sales price was 1.3% higher than the prior year. Wisconsin trends in home sales and prices were similar to national trends.
The housing market is interest rate sensitive. As the Federal Reserve increased interest rates in 2022, both home sales and prices declined. Expect at least one more 25 basis point increase in the federal funds rate in late March. Further increases are possible, as economic uncertainty remains in 2023. Further rate increases will be a function of inflation, economic growth, and the job market. Although inflation has cooled, it remains significantly above the Federal Reserve’s long-term target of 2%.
The job market remains strong, but economic uncertainty and further Federal Reserve rate hikes will likely continue to temper near-term housing sales and prices.
For further information:
- GDP Growth (and other national data) from the Bureau of Economic Analysis
- From the Federal Reserve
- From the National Association of Realtors
- From the Wisconsin Realtors Association

Kevin Bahr is a professor emeritus of finance and chief analyst of the Center for Business and Economic Insight in the Sentry School of Business and Economics at the University of Wisconsin-Stevens Point.