In September, the Federal Reserve decided to keep its target interest rate, the federal funds rate, unchanged. In March 2022, the Federal Reserve began the upward trek for interest rates, with 11 rate increases occurring through August 2023. The objective of the rate increases was to lower consumer and business spending, which in turn would lower inflation through reduced demand for products and services. Although global factors outside the control of the Federal Reserve were the primary drivers of recent inflation, the Federal Reserve was focusing on what it could do to lower inflation – increase interest rates. Since early 2022, the labor market has been a key focus for the Federal Reserve in forming interest rate policy. Unemployment, wage and job growth, and available jobs have played an important role in determining Federal Reserve policy and interest rate levels. The strength of the labor market affects consumer spending, which in turn affects the demand for products and services and consequently inflation. This blog will explain how inflation, interest rates and the labor market have been intertwined, particularly since early 2022.
Inflation
A frustrating challenge for the Federal Reserve was that the primary factors driving recent inflation were global – outside the control of the Federal Reserve. Those factors peaked in 2022, and included price spikes in global energy and food prices related to Putin’s invasion of Ukraine and lingering supply chain issues which contributed significantly to inflation.
Russia is a leading global exporter of oil, and oil prices spiked from approximately $75 a barrel in late December 2021 to almost $120 a barrel in June 2022 after the Russian invasion of Ukraine in February caused great uncertainty in global oil markets. The increased oil prices not only affected global energy costs, but also transportation costs for goods worldwide, both key factors contributing to global inflation. The Russian invasion of Ukraine also had a significant impact on food prices. Global fertilizer prices rose to record levels in 2022. According to the Unites States Department of Agriculture, fertilizer prices account for nearly one-fifth of U.S. farm cash costs, with an even greater share for corn and wheat producers. The Russian invasion of Ukraine triggered import-export restrictions that compounded supply problems. Russia and Belarus comprise nearly 25 percent of the global export market share of all fertilizers. Wheat prices spiked 50% in early 2022, as wheat exports were disrupted by the war. Russia and Ukraine accounted for approximately 30% of global wheat exports prior to the war.
Supply chain disruptions, exemplified by the auto industry, also significantly contributed to inflation. Between April 2021 and July 2022, new vehicle prices in the U.S. increased nearly 16%. Over that same period, vehicle sales declined by over 26% from 18.8 million to 13.8 million. New vehicle sales in July 2022 were lower than at any time between January 2012 and February 2020, before the impact of COVID on the economy. Supply chain issues (semiconductor chip shortages) were primarily driving the price increase, not consumer demand.
In 2023, the mitigation of these global factors led to a significant decline in inflation throughout the world. After peaking at nearly $120 a barrel in June 2022, oil prices were approximately $75 a barrel in June 2023. The August 2023 price of wheat declined nearly 50% from a its peak in February 2022. Supply chain problems also generally declined, as reflected by a 3.5% price increase (rather than double-digit) for new vehicles for the 12 months ended July 2023.
The chart below demonstrates how inflation was a global problem, not simply caused by U.S. domestic factors. The mitigation of global factors that contributed to inflation are reflected by the significant decline in inflation that has generally occurred around the world since 2022.
2022 Peak Annualized Inflation Rates and July 2023 Inflation Rate
| 2022 Peak Inflation Rate | August 2023 Inflation Rate | |
| Euro Area | 10.6 | 5.2 |
| Canada | 8.1 | 4.0 |
| United Kingdom | 11.0 | 6.7 |
| Mexico | 8.7 | 4.6 |
| Australia* | 7.8 | 6.0 |
| U.S. | 9.0 | 3.7 |
*Australia provides quarter to quarter inflation rate.6.0 rate is for quarter ending June 2023.
Although global inflation has declined from 2022 peak levels, a problematic factor has been the recent rise in global oil prices. In an effort to raise oil prices, Saudi Arabia and Russia jointly agreed to significant production cuts. After hitting a 2023 low of approximately $75 a barrel in June, oil prices increased to over $90 a barrel in September. U.S. inflation increased from 3.2% in July to 3.7% in August, with over half of the inflation increase attributed to rising gas prices.
Interest Rates
The Federal Reserve strongly influences interest rates in the U.S. economy through targeting the fed funds rate, a very short-term interest rate, which is the overnight borrowing rate between banks. The primary tool that the Federal Reserve has to combat inflation is through increasing the fed funds rate, which in turn increases borrowing costs and lowers consumer and business demand. A decline in consumer spending in particular could lower inflation, as consumer spending accounts for approximately two-thirds of economic growth as measured by the change in gross domestic product (GDP), which is the value of goods and services produced in the U.S. during a specified time period.
Central banks around the world, including the United States, Europe, the United Kingdom, Australia and Canada, have all raised interest rates to combat inflation. In September, the European Central Bank raised interest rates by a quarter of a percentage point to 4%, the highest level ever since the launch of the euro currency in 1999. The European Central Bank has raised interest rates at ten consecutive meetings. An exception to rising interest rates has been China, which has reduced interest rates to counter sluggish economic growth.
In March 2022, the Federal Reserve began the upward trek for U.S. interest rates, with eleven rate increases occurring through August 2023. In March 2020 the fed funds rate was reduced to the historical low of 0.00 – 0.25% to help stimulate an economy that severely contracted due to COVID. Economic growth returned in the second half of 2020, and in 2021 global inflation began to ramp up. In 2022, the fed funds rate was increased seven times to over 4% by the end of the year in an effort to lower inflation. In 2023, four additional rate increases brought the fed funds rate to 5.25 – 5.50%, the highest it had been since 2006. At its September meeting, the Federal Reserve kept the fed funds rate at 5.25 – 5.50%.
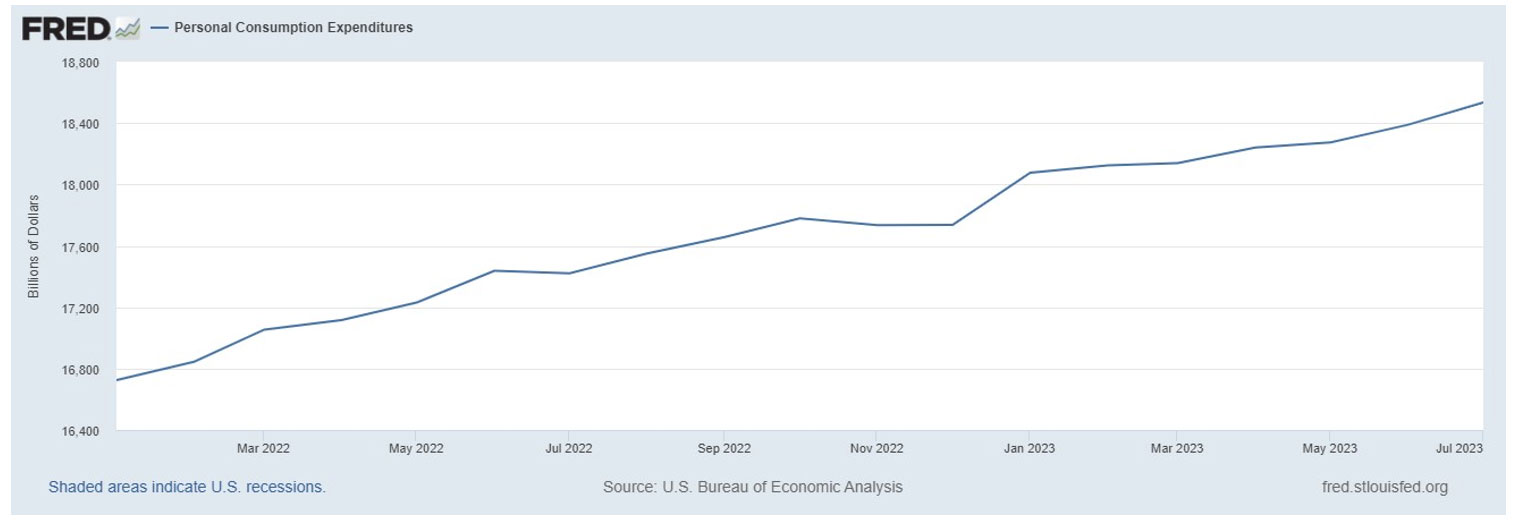
After peaking in 2022, U.S. and global inflation declined significantly in 2023, largely due to the mitigation of global factors that contributed to high inflation. What generally hasn’t declined since the Federal Reserve began raising interest rates in early 2022 is consumer spending. Despite higher financing costs due to eleven interest rate increases by the Federal Reserve, consumer spending, which accounts for two-thirds of GDP, has remained resilient. The graph below shows Personal Consumption Expenditures since January 2022.
Personal Consumption Expenditures, January 2022 – July 2023
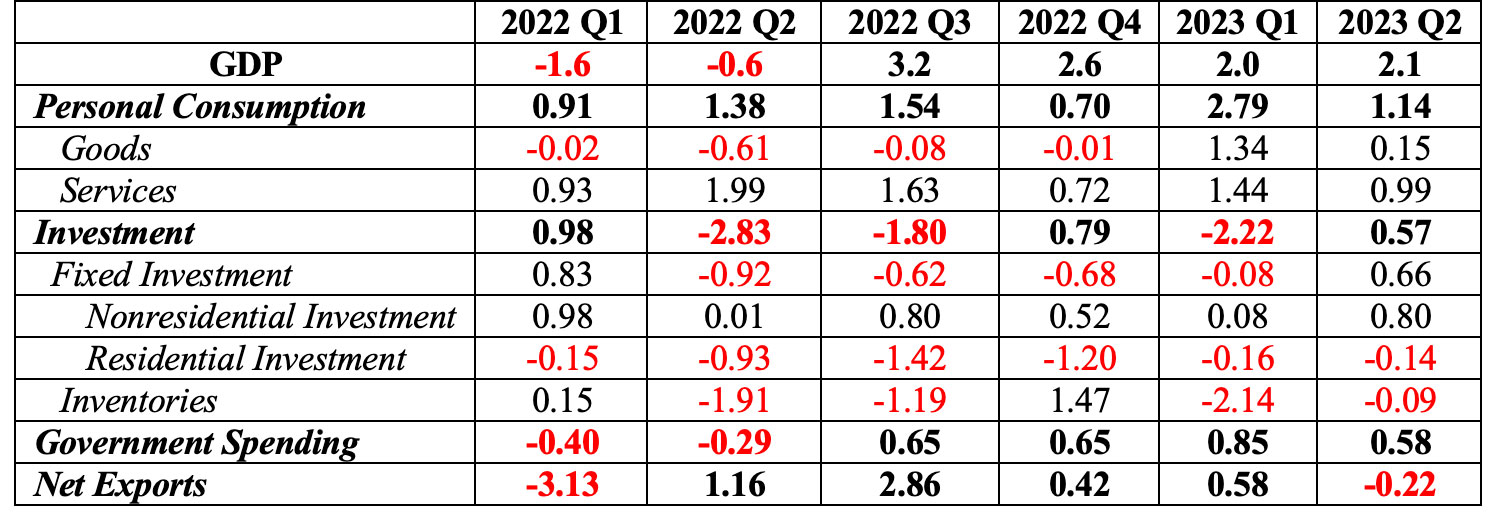
The importance of personal consumption to continued economic growth despite eleven interest rate increases since March 2022 can be seen in the table below. The table shows how changes in the four components of GDP contributed to the change in U.S. economic growth since the first quarter of 2022. Despite rising interest rates in 2022 and 2023, personal consumption remained relatively strong, positively contributing to GDP growth in every quarter, and being the primary driver of economic growth in four out of six quarters. Investment spending has fluctuated with rising interest rates, but personal consumption has remained positive. Personal consumption accounts for approximately two-thirds of GDP, and personal consumption has been the key, consistent, driver of economic growth during the economic recovery, contributing positively to GDP growth since the third quarter of 2020.
Contributions to Percent Change in Real Gross Domestic Product– Annualized Rate
The Labor Market
The continued strength of strong consumer spending despite interest rate increases reflects an extremely strong labor market, particularly since early 2022. By several measures, the labor market has been historically strong; however, there were signs that the labor market was softening slightly in August.
The onset of COVID in 2020 caused the unemployment rate to skyrocket from a pre-COVID low of 3.5% in February 2020 to a peak of 14.7% in April, a two-month increase of 11.2%. Since April 2020, the unemployment rate has generally declined. The table below shows the unemployment rate since 2022. The unemployment rate has been below 4.0% from February, 2022 through August, 2023. The streak of 19 consecutive months with an unemployment rate below 4.0% is the longest monthly streak since the 1960s. In January 2023, the unemployment rate bottomed out at 3.4%, the lowest rate since 1969. However, the unemployment rate increased to 3.8% in August, partially reflecting slowing job growth, increased labor force participation, and a softening job market.
Unemployment Rate
| Year | Jan | Feb | Mar | Apr | May | Jun | Jul | Aug | Sep | Oct | Nov | Dec |
| 2022 | 4.0 | 3.8 | 3.6 | 3.6 | 3.6 | 3.6 | 3.5 | 3.7 | 3.5 | 3.7 | 3.6 | 3.5 |
| 2023 | 3.4 | 3.6 | 3.5 | 3.4 | 3.7 | 3.6 | 3.5 | 3.8 |
The chart below shows total employment (in thousands) since the turn of the century. More Americans were working in August 2023 than ever before. Over 156 million Americans were employed in August 2023, an increase of approximately 26 million since the April 2020 COVID low of 130 million. Although the number of Americans working was at a record level in August, the number of jobs added to the economy was less than 200,000 for three consecutive months, the lowest level of jobs added since 2020, another signal that the job market was finally cooling.
Total Employees, Thousands January 2000–August 2023

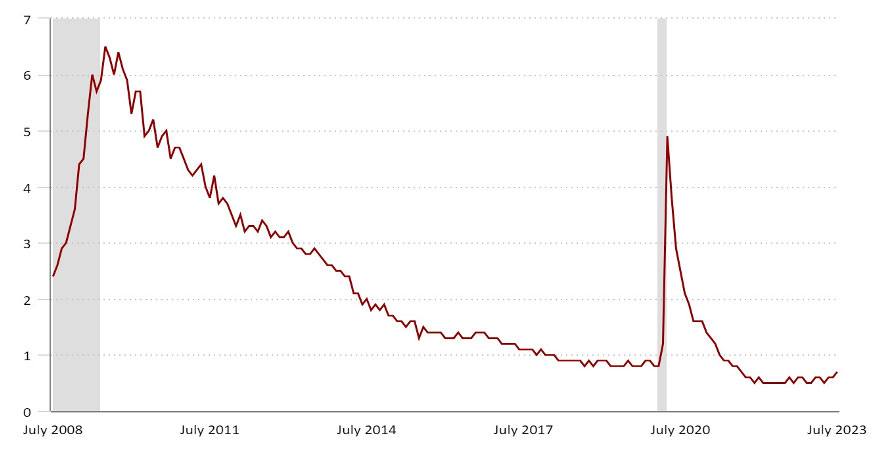
The chart below shows the number of unemployed workers per job opening since July, 2008. The number of unemployed workers to job openings has been less than one since June 2021, lower than at any other time this century. In other words, there were almost two job openings for every one person unemployed. “Labor shortages” appeared in many industries, leading to a relatively strong increase in wages that began in 2021. However, the number of unemployed persons per job opening increased slightly in July as the number of job openings decreased, another indication that the labor market was slowing down.
Number of Unemployed Persons per Job Opening (July 2008–July 2023)
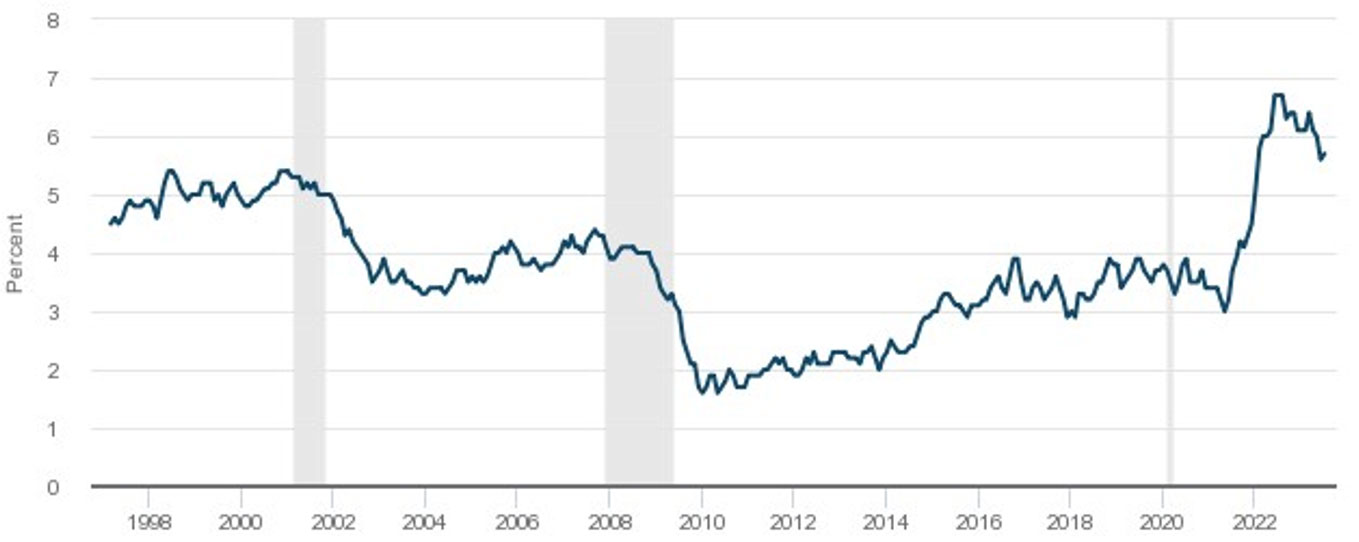
The Atlanta Fed’s Wage Growth Tracker is a measure of the nominal (unadjusted for inflation) wage growth of individuals. The graph below shows the 3-month moving average of median wage growth since 1998. Reflecting the strong labor market, wage growth increased significantly beginning late in 2021, leading to the strongest wage growth this century. Wage growth was 4.2% in September 2021, the highest growth since 2008, and peaked at 6.7% in August, 2022.
Although wage growth increased in 2022, the rate of inflation exceeded wage growth, which contributed to a decline in real household income. That trend reversed in 2023, as wage growth has exceeded the inflation rate since February 2023, contributing to an increase in real household incomes.
Although real incomes have increased in 2023, the generally declining trend in wage growth in 2023 is another indication of a softening labor market.
Wage Growth Tracker: 3-Month Moving Average of Median Wage Growth, Hourly Data
Summary
After peaking in 2022, U.S. and global inflation significantly declined in 2023 due to the mitigation of factors that drove excessive levels of inflation. The Russian-Ukraine war was a driving factor in 2022 global inflation, with Putin’s invasion contributing to a spike in global oil and commodity prices, as well as record high agricultural fertilizer prices. Declining oil and commodity prices, as well as a return to some degree of supply chain normalcy for most products, contributed to lower inflation in 2023. Although global inflation has declined significantly from 2022 peak levels, recent joint production cuts by Saudi Arabia and Russia have fueled an approximate 20% increase in the global price of oil since June and U.S. inflation increased slightly in August.
While inflation currently remains above the Federal Reserve’s targeted 2% level, the recent softening of the labor market significantly contributed to the Federal Reserve’s decision in September to keep the fed funds rate at 5.25–5.50%. The Federal Reserve focuses on changes in prices for Personal Consumption Expenditures (PCE), which are the products and services that consumers are purchasing. Further rate changes are subject to changing economic conditions, so questions remain about interest rate changes later in the year. However, another interest rate increase is possible in 2023, as economic projections released in September indicate that the Federal Reserve expects the fed funds rate to peak at 5.6% this year before declining to 5.1% next year. Two more meetings are scheduled for the Federal Reserve to discuss changes in interest rates, in late October and mid-December.
The U.S. economy has shown strong resilience through the period of rising interest rates, with unexpected moderate economic growth exceeding 2% in the first half of 2023. The labor market has also been very strong, with the longest monthly streak of unemployment below 4% since the 1960s. The rising interest rates and declining inflation of the U.S. generally reflects what has been occurring globally.
While economic growth has continued and the labor market have been strong, American households haven’t always felt it. Real household incomes declined in 2022 due to a variety of factors, including inflation outpacing wage increases, and tax law changes that reduced the Earned Income Tax Credit, Child Tax Credit, and the Child and Dependent Care Tax Credit. Expanded credits were created by the American Rescue Plan but expired in 2022. In addition, most households also received Economic Impact Payments in 2021 that were no longer issued in 2022. However, household incomes benefited in 2023 as wage growth finally exceeded inflation, contributing to growth in real household incomes.
While uncertainty certainly exists in economic forecasting, the Federal Reserve’s economic projections released in September anticipate a “soft landing” for the American economy, with continuing economic growth, a relatively strong labor market, and declining inflation continuing through 2024. Economic growth of 2.1% is expected for 2023 and 1.5% for 2024, reflecting a slowing but growing economy as inflation cools. The Federal Reserve expects inflation on PCE to peak at 3.7% this year before cooling to 2.6 % next year, while unemployment is expected to increase slightly to 4.1% in 2024.
For further information:
- From the Federal Reserve:
- From the United States Department of Agriculture: Impacts and Repercussions of Price Increases on the Global Fertilizer Market
- From macrotrends: Wheat Prices
- Info from the Bureau of Labor Statistics:
- From Eurostat: Euro Area Inflation
- From the Bank of Canada: Canadian Inflation
- Global Inflation, from rateinflation.com: https://www.rateinflation.com/inflation-rate/canada-historical-inflation-rate/
- From the Atlanta Federal Reserve: Wage Growth Tracker
- GDP Growth (and other national data) from the Bureau of Economic Analysis: GDP Growth
- From the U.S. Census Bureau: Household Median Income
- From Yahoo Finance: Summary of Fed Economic Projections

Kevin Bahr is a professor emeritus of finance and chief analyst of the Center for Business and Economic Insight in the Sentry School of Business and Economics at the University of Wisconsin-Stevens Point.