
This report will provide a summary of the 2023 performance for a myriad of economic measures and offer a glimpse of what’s on the economic horizon for 2024. In addition, the underlying factors that drove the economic changes in 2023 will be explored.
Overall, and relative to most developed countries, the U.S. economy performed extremely well in 2023. Economic growth remained surprisingly resilient despite rising interest rates. Consumer spending drove moderate growth in the first half of the year and strong growth in the third quarter. The labor market was the strongest it had been since the 1960s. Inflation declined significantly and was lower than inflation in most developed countries, but remained higher than desired.
American families, however, may not have completely felt the strength of the economy. Home affordability became more challenging as rising interest rates followed a spike in housing prices that began in 2020 but began to subside in 2023. The housing market, combined with significant price increases in items like food and autos that occurred in previous years, created financial challenges. It is important to note that the median net worth of American families has increased significantly since 2019, debt burdens have generally declined, and real wages increased in 2023 due to the strong labor market.
Economic Growth
In response to rising inflation, in March 2022 the Federal Reserve began a policy of aggressively raising interest rates to lower overall demand and consequently economic growth. The Federal Reserve targets the “fed funds rate” – a very short-term interest rate (the overnight borrowing rate between banks) that when changed, typically has a rippling effect through the financial markets. Increasing the fed funds rate increases borrowing costs and lowers interest rate sensitive spending by consumers and business. Although global factors outside the control of the Federal Reserve were the primary drivers of recent inflation, the Federal Reserve was focusing on what it could do to lower inflation – increase interest rates.
After beginning 2022 at 0.00-0.25%, the fed funds rate was increased seven times to a targeted range of 4.25-4.50% by yearend. As a result of the aggressive increase, by late 2022 many economic forecasts for 2023 were hoping for a “soft landing” (weak economic growth) but an economic recession (negative economic growth for two or more consecutive quarters) seemed increasingly plausible. In its December 2022 projections, the Federal Reserve expected economic growth of only 0.5% in 2023. The upward trek in interest rates continued in 2023, with four more rate hikes putting the fed funds rate at 5.25-5.50% in July.
Despite rapidly increasing interest rates and economic prognostications of weak economic growth at best, the U.S. economy in 2023 remained resilient with moderate economic growth in the first-half of the year, and strong economic growth in the third quarter.
The table below shows how changes in the four components of Gross Domestic Product (GDP) contributed to the change in U.S. economic growth since the third quarter of 2022. (Economic growth is measured by changes in GDP, which is the value of goods and services produced in a given time period.) Although rising interest rates slowed the economy in the first half of 2023 relative to the second half of 2022, moderate economic growth of 2.2% and 2.1% occurred in the first and second quarter, respectively. Third quarter economic growth was exceptionally strong, at 4.9%. While investment spending fluctuated with rising interest rates, personal consumption remained robust and was the primary driver of economic growth in 2023. Personal consumption accounts for approximately two-thirds of GDP, and personal consumption has been the key, consistent, driver of economic growth during the economic recovery, contributing positively to GDP growth since the third quarter of 2020.
Contributions to Percent Change in Real Gross Domestic Product– Annualized Rate
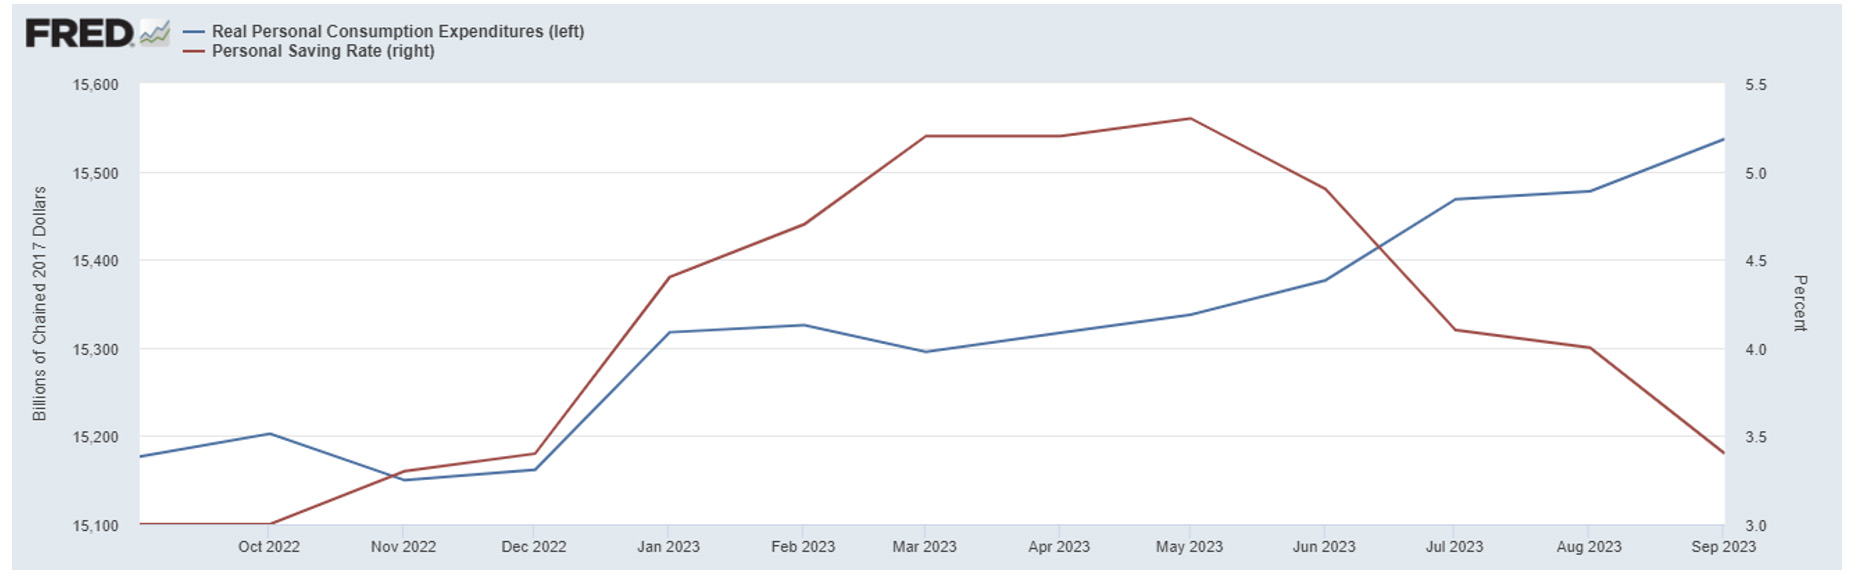
Fueling the growth in personal consumption has been an extremely strong labor market combined with a decline in the personal savings rate. The chart below shows real consumer spending (consumer spending adjusted for inflation) and the personal savings rate for the twelve months ended September 2023. Real personal consumption expenditures are indicated by the blue line (left axis); the personal savings rate is indicated by the red line (right axis). After dipping slightly at the end of 2022, real consumer spending increased approximately 2.5% between December 2022 and September 2023, with monthly increases occurring between April and September. In other words, consumers weren’t just spending more because prices were higher, they were buying more stuff. After peaking at 5.3% in July, the personal savings rate declined significantly to only 3.4% in September.
Real Consumer Spending (blue line) and Personal Savings Rate (red line)
Sept. 2022 – Sept. 2023
Labor Market
The U.S. labor market is in the midst of one its strongest periods ever. More Americans are working than ever before, the unemployment rate has been relatively low for a prolonged period of time, and in 2023 real wages increased. The strong labor market has contributed to economic growth through increased consumer spending.
The table below shows the unemployment rate since January 2022. The unemployment rate was below 4.0% from February 2022 through October 2023. The streak of 21 consecutive months with an unemployment rate below 4.0% was the longest monthly streak since the 1960s. In January 2023, the unemployment rate bottomed out at 3.4%, the lowest rate since 1969. Jobs were added in every month from January 2021 through October 2023. Although the unemployment rate has been rising since July, the total number of Americans working has continued to grow as labor force participation has increased.
Unemployment Rate
| Year | Jan | Feb | Mar | Apr | May | Jun | Jul | Aug | Sep | Oct | Nov | Dec |
| 2022 | 4.0 | 3.8 | 3.6 | 3.6 | 3.6 | 3.6 | 3.5 | 3.7 | 3.5 | 3.7 | 3.6 | 3.5 |
| 2023 | 3.4 | 3.6 | 3.5 | 3.4 | 3.7 | 3.6 | 3.5 | 3.8 | 3.8 | 3.9 |
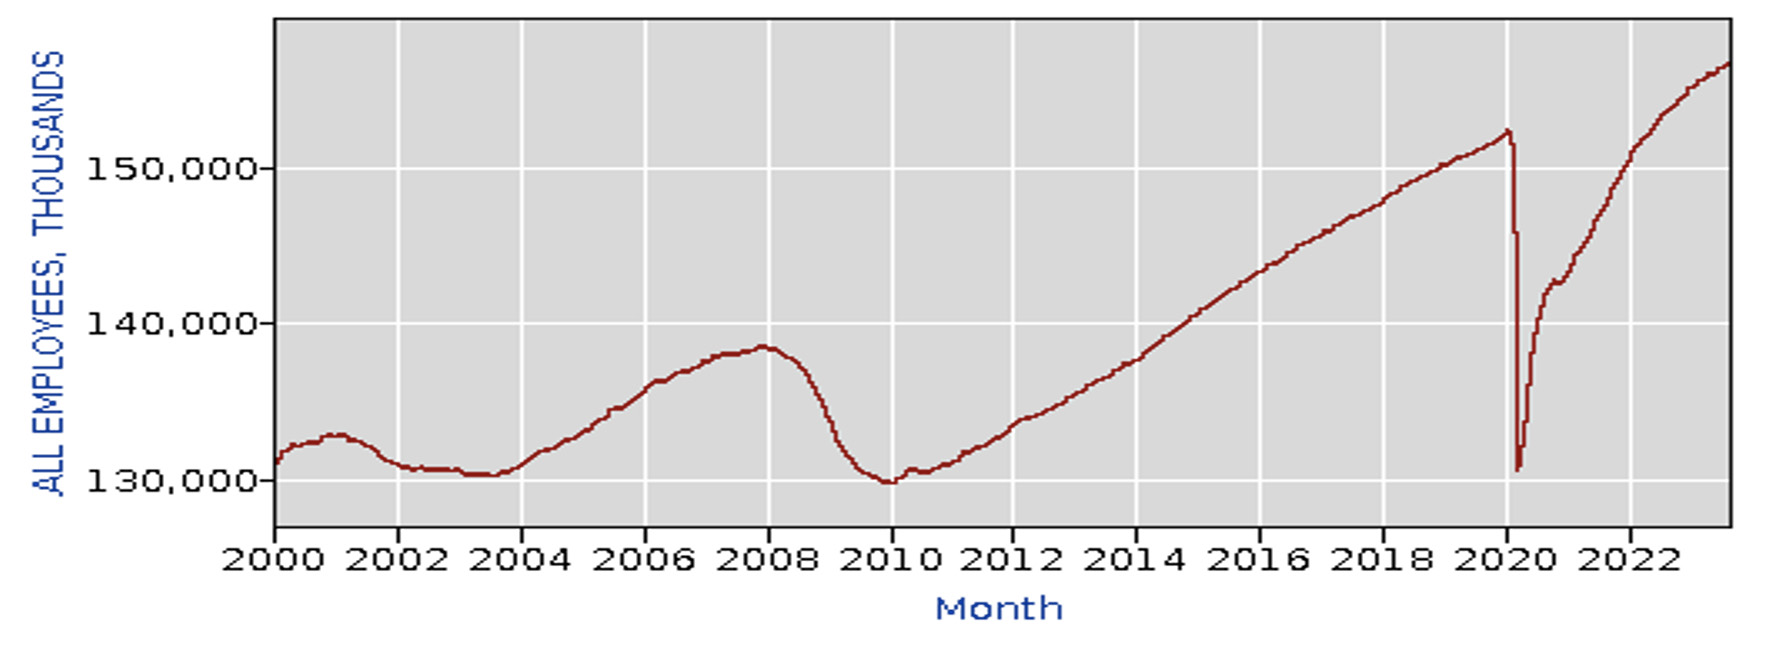
More Americans were working in October 2023 than ever before. The chart below shows total employment (in thousands) since the turn of the century. Approximately157 million Americans were employed in October 2023, an increase of 27 million workers since the April 2020 COVID low of 130 million. Approximately 5 million more Americans were working in October 2023 than December 2019. The decreasing slope of the line in the chart reflects monthly job gains in 2023 have generally been less relative to 2022. Although the labor market remains strong, the monthly decline in job gains indicates some softening has occurred since early 2023.
Total Employees, Thousands January 2000 – October 2023
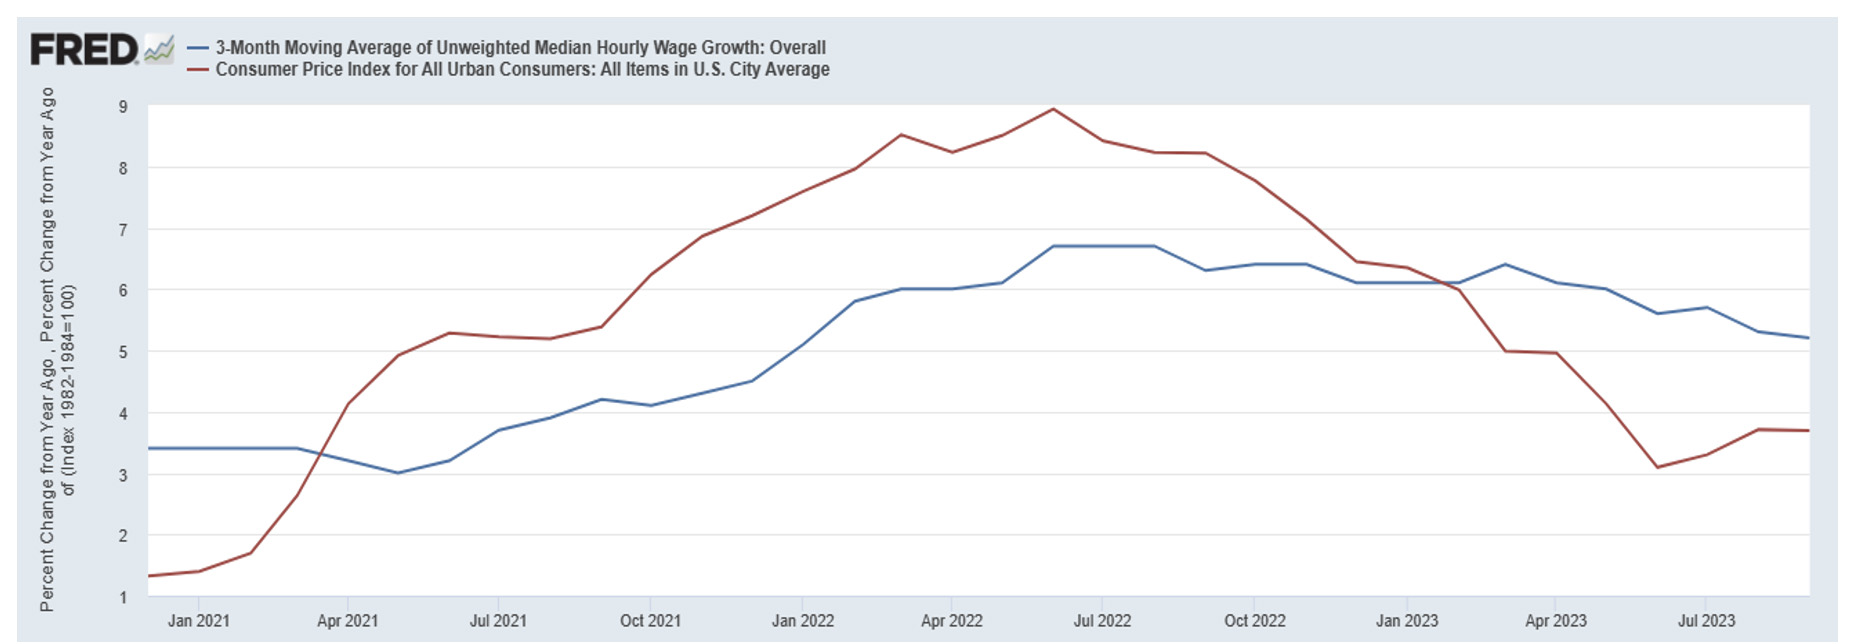
The chart below shows the 3-month moving average of median hourly wage growth (blue line) relative to the annualized inflation rate (red line) as measured by the Consumer Price Index. Between April 2021and January 2023 inflation exceeded wage growth; consequently, real wages declined. However, the trend reversed in early 2023, and since February real wages increased as the growth in hourly wages exceeded the rate of inflation. Wage growth was 4.2% in September 2021, the highest growth since 2008, and peaked at 6.7% in August, 2022. The generally declining trend in wage growth in 2023 is another indication of a softening labor market.
3-Month Moving Average of Median Wage Growth, Hourly Data (blue line)
Annualized Inflation Rate, Consumer Price Index (red line)
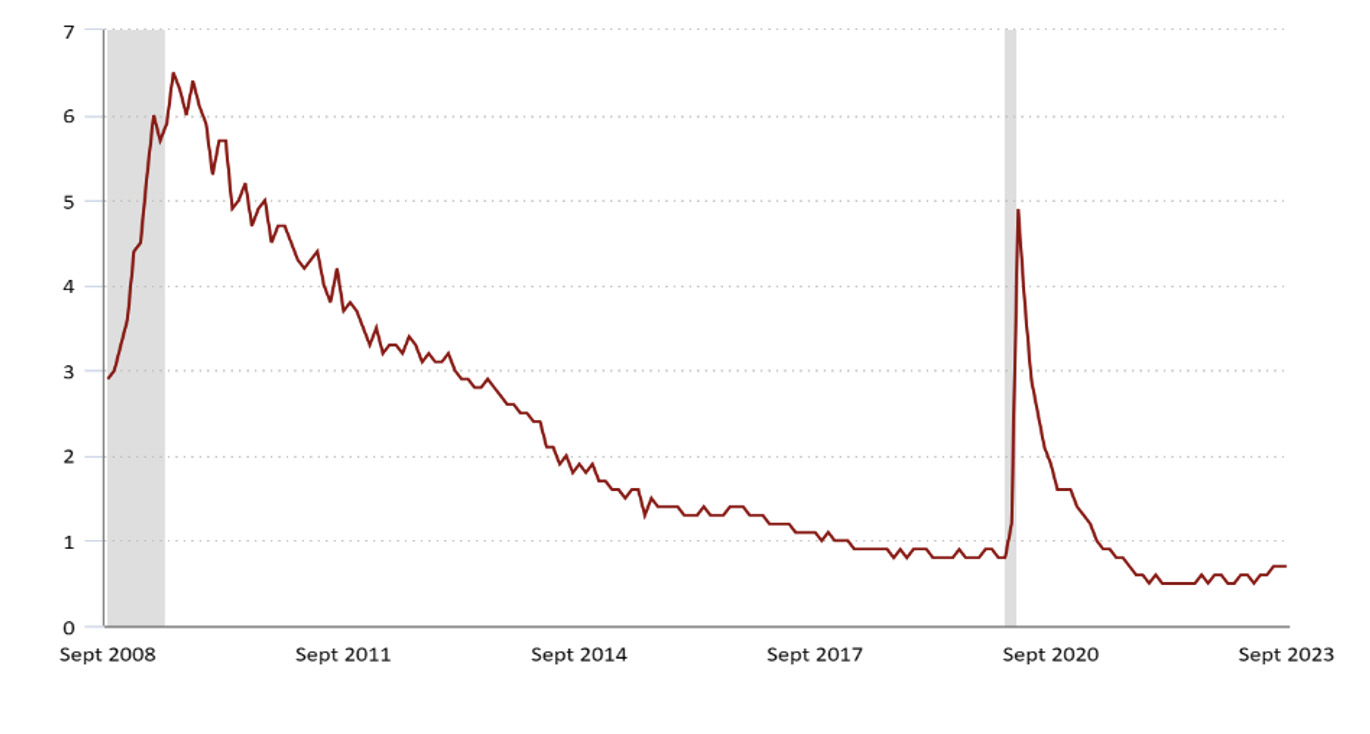
The chart below shows the number of unemployed persons per job opening since September, 2008. The number of unemployed workers to job openings has been less than one since June 2021, lower than at any other time this century. In other words, there was more than one job opening for every person unemployed. “Labor shortages” appeared in many industries, leading to a relatively strong increase in wages that began in 2021. However, the number of unemployed persons per job opening has recently increased slightly, another indication that the labor market was slowing down.
Number of Unemployed Persons per Job Opening (September 2008 – September 2023)
Inflation
Inflation in the U.S. spiked in April 2021 and continued to increase until it peaked in July 2022. The primary factors driving recent inflation were global – outside the control of the Federal Reserve. Those factors peaked in 2022, and included price spikes in global energy and food prices related to Putin’s invasion of Ukraine and lingering supply chain issues which contributed significantly to inflation.
Russia is a leading global exporter of oil, and oil prices spiked from approximately $75 a barrel in late December 2021 to almost $120 a barrel in June 2022 after the Russian invasion of Ukraine in February caused great uncertainty in global oil markets. The increased oil prices not only affected global energy costs, but also transportation costs for goods worldwide, both key factors contributing to global inflation. The Russian invasion of Ukraine also had a significant impact on food prices. Russia and Belarus comprise nearly 20 percent of the global export market share of all fertilizers, and global fertilizer prices rose to record levels in 2022. The Russian invasion of Ukraine triggered import-export restrictions that compounded supply problems. Wheat prices spiked 50% in early 2022, as wheat exports were disrupted by the war. (Russia and Ukraine accounted for approximately 30% of global wheat exports prior to the war.) Supply chain disruptions, exemplified by the semiconductor chip shortage, became prominent in 2021 and continued into 2022. Between April 2021 and July 2022, new vehicle prices in the U.S. increased nearly 16% with sales declining by over 26%.
In 2023, the mitigation of these global factors led to a significant decline in inflation throughout the world. After peaking at nearly $120 a barrel in June 2022, oil prices were approximately $75 a barrel in June 2023. The October 2023 price of wheat declined nearly 50% from its peak in February 2022. Supply chain problems also generally declined, as reflected by a 1.9% price increase (rather than double-digit) for new vehicles for the 12 months ended October 2023.
The chart below demonstrates how inflation was a global problem, not simply caused by U.S. domestic factors. Note the trends in inflation are generally similar across countries. The mitigation of global factors that contributed to inflation are reflected by the significant decline in inflation that has generally occurred around the world since 2022.
2022 Peak Annualized Inflation Rates and 2023 Inflation Rates
| 2022 Peak | Jan. 2023 | April 2023 | July 2023 | Sept. 2023 | Oct. 2023 | |
| Euro Area | 10.6 | 8.6 | 7.0 | 5.3 | 4.3 | 2.9 |
| Canada | 8.1 | 5.9 | 4.4 | 3.3 | 3.8 | – |
| United Kingdom | 11.0 | 10.1 | 8.7 | 6.8 | 6.7 | 4.6 |
| Mexico | 8.7 | 7.9 | 6.3 | 4.8 | 4.5 | 4.3 |
| Australia* | 7.8 | 7.8 | 7.0 | 6.0 | 5.4 | – |
| U.S. | 9.0 | 6.4 | 4.9 | 3.2 | 3.7 | 3.2 |
*Australia provides quarter to quarter inflation. 2023 numbers are for quarter ending previous month. 5.4 rate is for quarter ending September 2023.
The table below shows price changes for the U.S. Consumer Price Index (all items) and selected products over the 12-month period and 1-month ending in October 2023. For the 12-months ended October 2023 overall inflation declined to 3.2%, with core inflation (all items less food and energy) at 4.0%. Core inflation had its smallest 12-month change since the period ending in September 2021. The 1-month change in prices for all items was zero, with core inflation at 0.2%.
12-Month and 1-Month Percentage Change in Prices for Period Ending October, 2023
Source: U.S. Bureau of Labor Statistics 12-Month Change 1-Month Change
| All Items | 3.2 | 0.0 |
| Food | 3.3 | 0.3 |
| Food at Home | 2.1 | 0.3 |
| Food away from Home | 5.4 | 0.4 |
| Energy | -4.5 | -2.5 |
| Gasoline | -5.3 | -5.0 |
| All Items Less Food and Energy | 4.0 | 0.2 |
| Apparel | 2.6 | 0.1 |
| New vehicles | 1.9 | -0.1 |
| Used cars and trucks | -7.1 | -0.8 |
| Services less energy services | 5.5 | 0.3 |
| Shelter | 6.7 | 0.3 |
| Transportation services | 9.2 | 0.8 |
Food prices increased 3.3% for the 12-month period ending in October 2023, with food at home prices increasing 2.1% and food away from home prices increasing 5.4%. Energy prices decreased 4.5% over the 12-month period with gasoline prices declining 5.3%. New vehicle prices increased 1.9% while used vehicle prices dropped 7.1%. Shelter and Transportation Services had significant increases over the past year at 6.7% and 9.2%, respectively. The shelter index, which includes housing and rent prices, was the largest factor in the monthly increase in the index for all items less food and energy in both September and October.
A domestic factor that has played a significant role in increasing inflation over the past few years is the housing market. The chart below shows the housing inventory (number of listings) and the median sales price for houses since July 2016. The housing inventory is indicated by the blue line (left axis); the median sales price for houses is indicated by the red line (right axis).
Despite relatively low mortgage rates and a strong demand for houses, housing prices remained relatively level from July 2016 through December 2019. Housing prices began to surge in 2020 as home inventory (active listings) plummeted. Although mortgage rates began a significant rise in early 2022 as the Federal Reserve began the upward trek for interest rates, housing prices continued to climb as home inventory remained low. Between the first quarter of 2020 through the fourth quarter of 2022, the quarterly median sales price increased approximately 46%! The percentage increase in prices over those three years nearly matched the percentage increase that occurred over the entire last decade. Between the first quarter of 2010 and the fourth quarter of 2019, the quarterly median sales price increased approximately 47%. Finally, in early 2023, home prices fell as home inventories rose and mortgage rates continued upward.
Housing Inventory, Number of Active Listings (blue line)
Median Sales Prices of Houses Sold (red line)

Interest Rates
The Federal Reserve strongly influences interest rates in the U.S. economy through targeting the fed funds rate, a very short-term interest rate, which is the overnight borrowing rate between banks. The Federal Reserve can sell bonds of varying maturities from its portfolio of Treasury securities, which takes money out of the financial system and can also put upward pressure on long-term interest rates as bond prices decline with the sale of bonds. Rising interest rates negatively affect interest rate sensitive business investment and consumer purchases as financing costs increase.
When the Federal Reserve changes the fed funds rate, there is typically a rippling effect through the financial markets. This relationship is demonstrated in the chart below, which shows the effective federal funds rate since January 2020 (blue line) relative to the 30-year fixed rate mortgage average (red line). In March 2022, the Federal Reserve began the upward trek for interest rates, with eleven rate increases occurring through November 2023. Note that when the Federal Reserve raised the fed funds rate the 30-year fixed rate mortgage average correspondingly increased.
Effective Federal Funds Rate (blue line)
30-year Fixed Rate Mortgage Average (red line)

The Federal Reserve has a dual mandate – goals of maximum employment and stable prices. In other words, the Federal Reserve tries to balance economic growth (to maximize employment) with an inflation target of 2% for Personal Consumption Expenditures (PCE), which are the products and services that consumers are purchasing. In March 2022, the Federal Reserve began the upward trek for interest rates, with eleven rate increases occurring through November 2023. The objective of the rate increases was to lower consumer and business spending, which in turn would lower inflation through reduced demand for products and services. Although global factors outside the control of the Federal Reserve were the primary drivers of recent inflation, the Federal Reserve was focusing on increasing interest rates to lower inflation to its 2% targeted level.
Since early 2022, the labor market has been a key focus for the Federal Reserve in forming interest rate policy. Unemployment, wage and job growth, and available jobs have played an important role in determining Federal Reserve policy and interest rate levels. The strength of the labor market affects consumer spending, which in turn affects the demand for products and services and consequently inflation. While inflation currently remains above the Federal Reserve’s targeted 2% level, softening of the labor and housing markets in 2023 contributed to the Federal Reserve’s decision to pause interest rate increases following a July rate hike. Further rate hikes, however, are possible, depending on changing economic conditions.
Central banks around the world have responded similarly to inflation, with interest rate increases beginning in 2022. In September 2023, the European Central Bank raised interest rates by a quarter of a percentage point to 4%, the highest level ever since the launch of the euro currency in 1999. The European Central Bank raised interest rates at ten consecutive meetings before pausing in October. The Canadian central bank gradually raised its policy interest rate from 1.5% in June 2022 to 5.0% in July 2023 before pausing interest rate hikes. The Bank of England began raising its bank rate from 0.10% in November 2022 to 5.25% in August 2023 before ending rate hikes. Australia’s central bank gradually raised interest rates from 0.10% in April 2022 to 4.1% in June 2023. Inflation was a global problem; central banks around the world raised interest rates to decrease interest rate sensitive consumer and business spending. An exception to rising interest rates has been China, which has reduced interest rates to counter sluggish economic growth.
Have American Family (Household) Finances Gotten Better?
In October 2023 the Federal Reserve released its triennial Survey of Consumer Finances, which compared American family (household) finances in 2022 relative to 2019. Data in the survey is presented in 2022 dollars, meaning that 2019 numbers have been adjusted for inflation. A summary of the survey is presented below:
- Between 2019 and 2022, real median net worth surged 37 percent, and real mean net worth increased 23 percent. Real median net worth grew from $141,100 to $192,900 while real mean net worth increased from $868,000 to $1.063 million. The growth in median net worth was the largest three-year increase since the survey in its current form began in 1992. Increases in both median and mean net worth were consistent across different types of families, grouped by either economic or demographic characteristics.
- Both financial and nonfinancial asset values rose significantly over the period. Overall, the real median asset value rose 26% from $263,800 to $332,600.
- The percentage of families with some type of debt remained approximately constant at 77%. However, the median leverage ratio (a family’s total debt relative to its total assets) declined to a 20-year low of 29.2 percent (down from 33.9 percent in 2019) for those families with debt. The median payment-to-income ratio dropped to 13.4 percent (down from 15.3% in 2019), the lowest level ever recorded in the survey.
- Between 2019 and 2022, the share of families with credit card debt remained approximately constant at 45 percent. However, the median balance for families with credit card debt declined from $3,100 to $2,700 and the mean balance declined from $7,300 to $6,100.
- The median net housing value (the value of a home minus home secured debt) increased significantly over the period as housing prices rose substantially and debt remained relatively flat. For families that owned a home, the median net housing value rose from $139,100 in 2019 to $201,000 in 2022. The homeownership rate increased slightly to 66.1 percent. However, home affordability declined significantly, as the surge in housing prices meant that the median home was worth over 4.6 times median family income in 2022, surpassing the previous high of 4.2 in 2007.
- Approximately two-thirds of working-age families participated in retirement plans in 2022, up slightly from 2019. Unfortunately, that means approximately one-third of families had no retirement plan other than Social Security. Overall, the mean retirement savings for those with retirement accounts aged 35-64 years old increased from $312,500 to $331,400. However, the mean retirement savings for those families in the bottom 50% of the income distribution declined from $66,600 to $54,700.
What’s Ahead for 2024
In no particular order, some of the economic challenges for 2024:
1. The Federal Budget Deficit and Federal Debt
Federal government funding, spending and debt have become hot political topics lately, and will likely continue to be controversial topics in 2024. The federal budget deficit refers to the amount U.S. federal government spending exceeds government income, which is primarily derived from tax revenues. When the federal government spends more than the tax revenue it takes in, a deficit occurs, which must be funded through the issuance of government debt. In some cases, deficits are desirable, such as in periods of economic downturns like the 2008 financial crisis and the COVID related economic downturn. During economic downturns, tax revenues decrease as the economy slows, which contributes to a budget deficit. Reducing government spending in an economic downturn could turn a recession into a depression. Consistent deficits lead to growing federal debt. Exactly how much federal debt is too much debt is open to discussion and not readily defined, but growing debt leads to a greater chunk of the federal budget going to pay interest on the debt, particularly if interest rates go up.
The graph below shows the relationship between federal budget deficits and the total public (federal) debt. The blue line (left axis) indicates the budget deficits or surpluses that have occurred since 1980. Federal government spending has consistently exceeded federal tax revenues since the 1980s. Except for a brief period between 1998 and 2001 when the U.S. was enjoying excellent economic growth and the tech boom in its internet infancy, the United States has had budget deficits since 1980. Major events that played a role in significantly increasing the budget deficit include: 1) the financial crisis of 2008, 2) the tax cuts of 2003 and 2018, and 3) the COVID crisis of 2020.
Economic downturns caused by the financial crisis and COVID had a double whammy on the budget deficit, evidenced by a significant reduction in tax revenues as economic growth turned negative and an increase in fiscal spending to stimulate economic recovery.
The budget deficit usually decreases during periods of economic growth. That, however, changed with the tax cuts of 2018, which contributed to increasing budget deficits during a period of economic growth that began in 2010 and ended with the onset of COVID. Between 2015 and 2019, the budget deficit doubled to over $900 billion. The Congressional Budget Office estimated in 2018 that the tax cut would increase deficits by approximately $1.8 trillion over 11 years. The tax cuts of 2018 occurred during a period of economic expansion and an unemployment rate of only 4.0%. The increasing budget deficit following the tax cuts ensured that a budget surplus was no longer obtainable, based on the tax laws and the federal government spending structure in place. The U.S. economy was approaching full employment, yet the budget deficit kept growing. The tax cuts set the stage for a ballooning deficit if something went wrong with the economy, like it did in 2020 with the onset of COVID. In fiscal year 2020, the budget deficit hit a record $3.1 trillion.
The red line (right axis) indicates the total public (federal) debt outstanding. Generally, the public (federal) debt outstanding reflects the accumulation of budget deficits, with subsequent budget deficits increasing the total public (federal) debt outstanding. Between 1980 and 2010, the debt rose from near $0 to approximately $10 trillion. Since 2010, the debt has approximately tripled to over $30 trillion with two major economic downturns and the 2018 tax cuts fueling the increase.
Federal Budget Surplus or Deficit; Total Public Debt
Annual amount of Federal Budget Surplus or Deficit in Millions of Dollars (1980 – 2022)
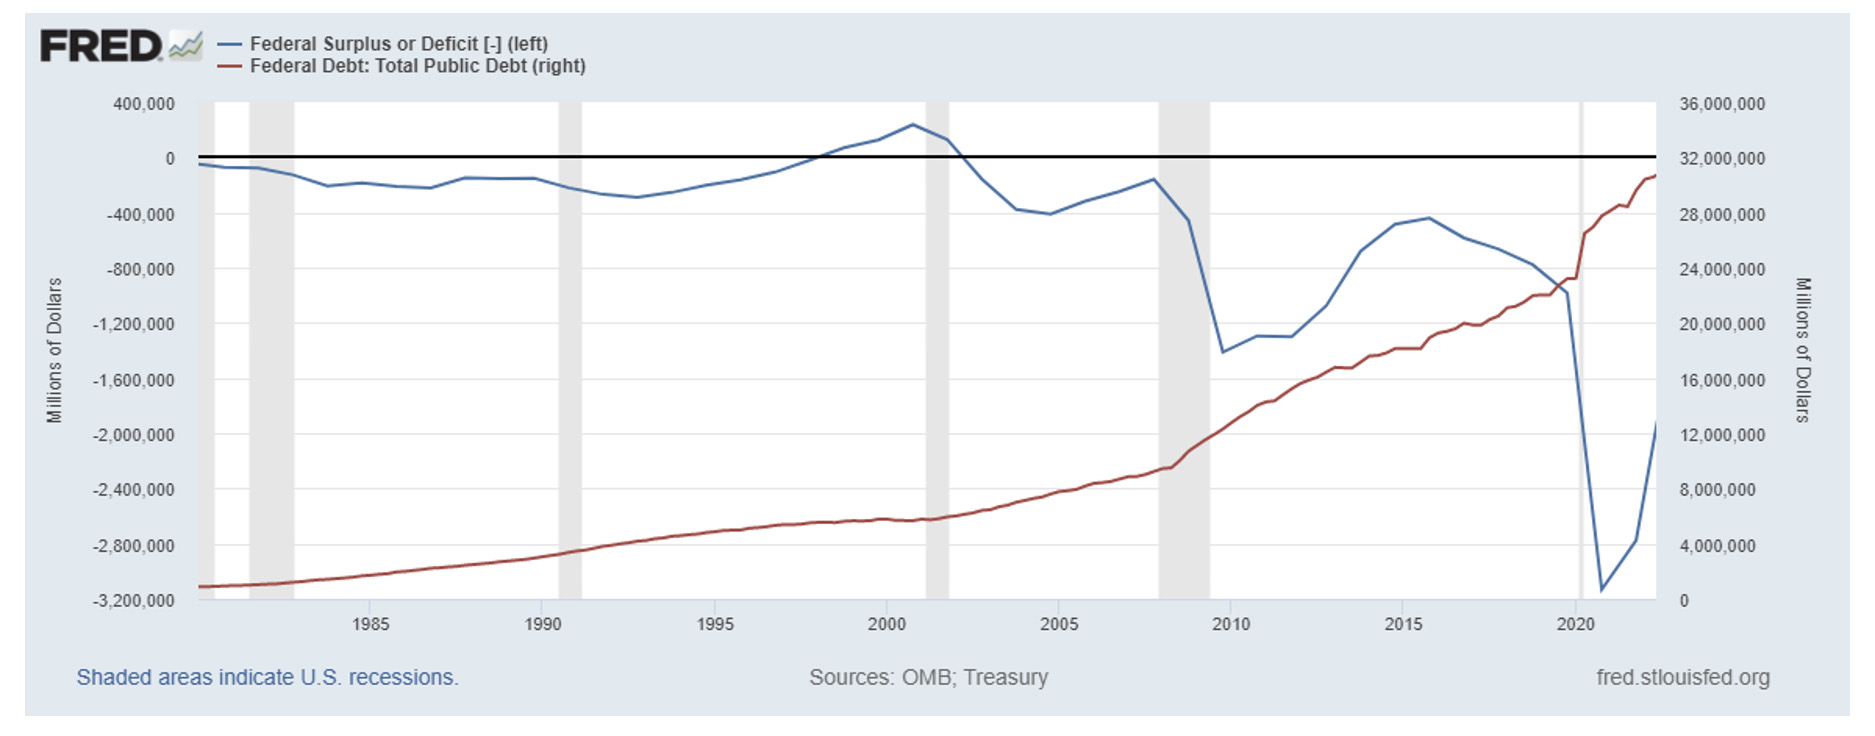
Generally, an expanding economy leads to a decrease in the U.S. federal government budget deficit as tax revenues increase. The economic expansion in the 1980s led to the deficit declining slightly in the late 1980s, and the strong economic expansion in the 1990s led to budget surpluses. Following the recession of the early 2000s and the financial and economic crisis of the late 2000s, the deficit once again was reduced when economic growth rebounded. However, the tax cuts of 2018 contributed to a growing budget deficit, and combined with the 2020 stimulus to bring the deficit to record levels which in turn pushed total debt to record levels.
How to reduce a budget deficit? The equation is pretty simple – either increase tax revenues or reduce government spending. Although the equation is simple, in this era of political harmony (just kidding) exactly what to change to reduce the budget deficit and debt is the hard part.
On the tax revenue side of the budget equation, an upcoming event is the expiration of the 2018 individual tax cuts. The U.S. theoretically has a progressive tax structure, with higher tax rates applying to income in higher tax brackets. As your income rises and reaches a higher tax bracket, only that portion of your income in the higher tax bracket is subject to a higher tax rate. There were seven tax brackets in 2017, with tax rates ranging from 10% for the lowest bracket to 39.6% for the highest bracket. In 2018 the tax brackets generally remained the same (adjusted for inflation), but tax rates were generally cut by 2-3% across almost all income brackets (the tax rate in the lowest income bracket remained the same). Tax rates currently range between 10% for the lowest bracket and 37.6% for the highest bracket. Because tax rates were cut for almost all income brackets, generally the greater your taxable income the greater the tax benefit received. The individual tax cuts passed in 2018 were temporary; they expire after 2025 unless extended or changed by law. No doubt a subject of future political discussion, the tax cuts could be kept for all tax brackets, selected tax brackets, or no tax brackets.
On the spending side, Social Security is the largest government expenditure and expected to grow in the future due to the aging of the American population. Social Security programs are funded through payroll taxes. Employees and their employers each pay 6.2% of earnings for Social Security taxes; an additional 1.45% of earnings are paid for Medicare taxes. In sum, a total of 15.30% of an employee’s earnings are subject to Social Security and Medicare taxes, with employee and employer each paying 7.65% of an employee’s earnings. There is a salary limit for Social Security taxes. The salary limit is $160,200 in 2023, with the salary limit typically adjusted each year by the approximate level of inflation. (There is no salary limit for Medicare taxes.) If you are thinking that the money you paid into Social Security by you and your employer will be there for you when you retire, alas, it’s not. Current payments into Social Security are being dispersed to those receiving benefits now – any excess payments remain in Social Security trust funds.
In 2021, Social Security’s total cost exceeded its total income (payroll taxes) for the first time since 1982. Disbursements are expected to continue to exceed program income for the foreseeable future, with money drawn from the trust funds to pay the difference. Current payments into Social Security being dispersed to current beneficiaries set the stage for financial difficulties when the demographics of the U.S. shifted to an aging population. By 2033, it is expected Social Security will only be able to pay 77 percent of scheduled benefits to retirees, unless something changes. The 2023 average monthly Social Security benefit for retirees was only $1,827.
2. Manufacturing, Sourcing, and Supply Chains
COVID painfully demonstrated that if globally sourced supply chains were interrupted, it could have significant, negative effects on the economy through reduced product availability and resulting price increases. There are reasons why global supply chains were developed by U.S. corporations, including utilizing low-cost sourcing, offering consumers lower prices, increasing global competitiveness, and maximizing profits. Although COVID impacts have waned, global political turmoil has increased which eventually could cause further supply chain disruptions.
Global supply chains, including sourcing from Southeast Asia, remain significantly important for many U.S. companies. The United States began a tariff and trade war with China in 2018 that included goals of shifting manufacturing jobs back to the U.S. and lessoning dependance on Chinese imports. Tariffs were placed on over approximately $350 billion of Chinese goods each year, with the tariffs largely remaining in place currently.
The table below shows the ranking of countries by total year-to-date imports through August, 2023. Despite the tariffs and political tension, U.S. companies continue to rely significantly on China for sourcing. China remains in third place for total imports with a year-to-date total of $375.8 billion, ranking behind only Mexico and Canada. Note that Taiwan ranks eighth, with year-to-date total imports of $56.5 billion.
Year-to-Date Imports of Goods by Country through August, 2023
Source: Foreign Trade Division, U.S. Census Bureau
Rank Country billions of $ % of total trade
| 1 | Mexico | 316.7 | 15.5% |
| 2 | Canada | 279.9 | 13.7% |
| 3 | China | 275.8 | 13.5% |
| 4 | Germany | 107.1 | 5.2% |
| 5 | Japan | 96.0 | 4.7% |
| 6 | Korea, South | 76.1 | 3.7% |
| 7 | Vietnam | 73.0 | 3.6% |
| 8 | Taiwan | 56.5 | 2.8% |
| 9 | India | 55.6 | 2.7% |
| 10 | Ireland | 54.9 | 2.7% |
Any escalation of political tensions with China that adversely impacts trade could have a significant effect on American consumers.
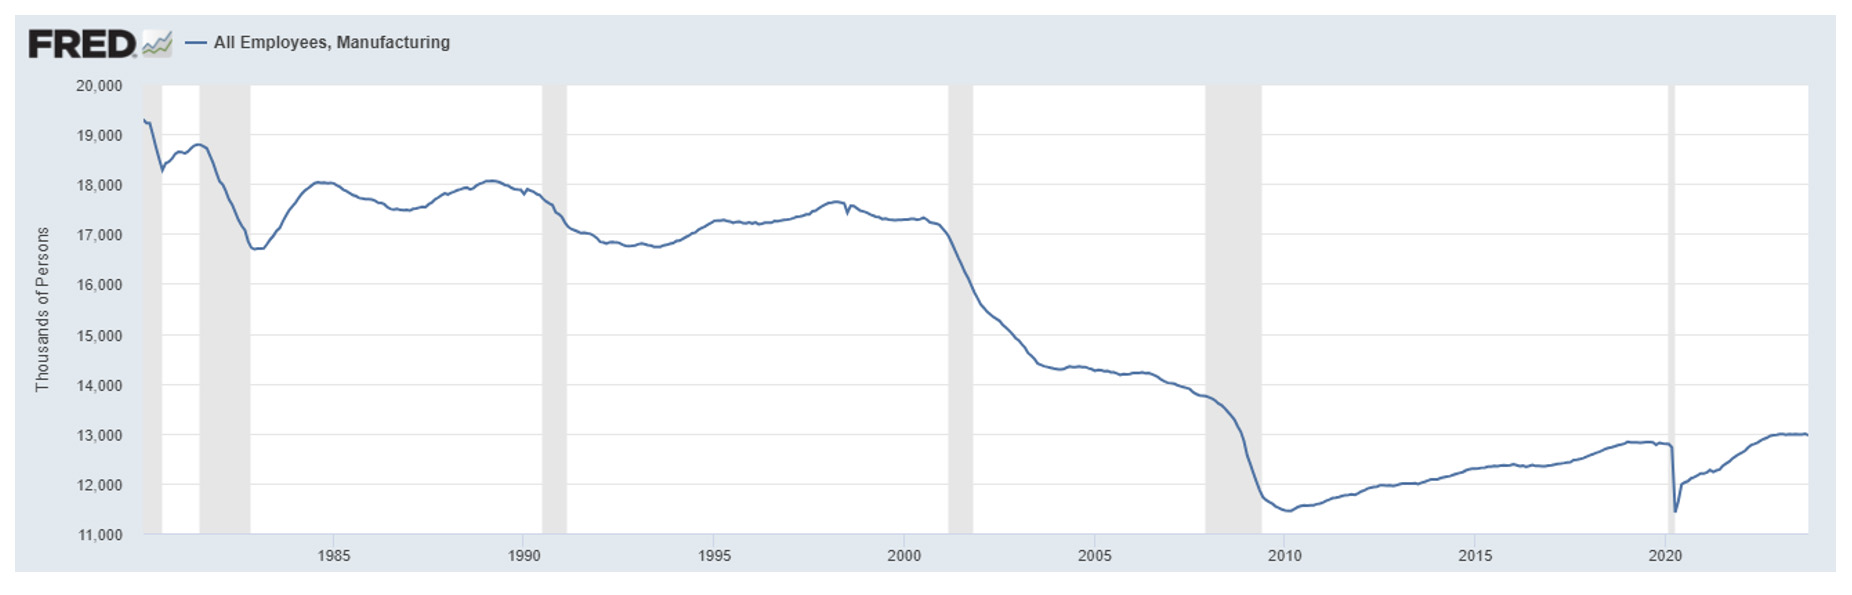
The chart below shows manufacturing employment in the U.S. since 1980. A long, gradual decline in manufacturing employment began in 1980. Although manufacturing employment rebounded slightly in the 1990s, the downward trend returned after the turn of the century with a sharp decline that generally continued through early 2010. After hitting a low of 11.5 million in early 2010, manufacturing employment steadily grew to 12.8 million in December 2019.
The immediate impact of the 2018 Chinese tariffs on U.S. manufacturing employment? Not much. Manufacturing employment in December 2019 was relatively unchanged from its December 2018 level of 12.8 million. Despite the growth in manufacturing employment during the economic expansion, the manufacturing sector ended the decade with almost 1 million fewer employees than what it had before the financial crisis. Manufacturing employment was 12.8 million in December 2019, an approximate 6.5% drop from the October 2007 level of 13.8 million. A primary benefactor of the tariffs on China was Vietnam. In some cases, Vietnam offered U.S. firms a low-cost sourcing alternative to China. In 2019 imports from Vietnam grew 34.6% to a record high of $66.6 billion, an increase of $17.4 billion from 2018.
Since the economic recovery began in May 2020, manufacturing employment has steadily rebounded. After hitting a low of 11.4 million in April 2020, economic growth and recent legislation promoting U.S. manufacturing pushed employment to 13 million in September 2023, the highest manufacturing employment has been since November 2008.
U.S. Manufacturing Employment 1980-2022
3. The Lag Effect of Rising Interest Rates
There is a lag between an increase in interest rates and the effects on the economy, but the exact timing and magnitude of the effects are difficult to discern. In March 2022, the Federal Reserve began the upward trek for interest rates, with eleven rate increases occurring through November 2023. From a low of 0.00-0.25% in May 2022, the fed funds rate hit 5.25-5.50% in July 2023. Due to the lag between interest rate increases and the economy, negative effects from recent interest rate increases will likely be felt in 2024. It’s the magnitude of the effects that is uncertain.
Rising interest rates began a toll on the housing market through higher mortgage rates in 2023 and business investment became more volatile, but the ultimate impact of rising interest rates on economic growth and consumer spending has yet to be felt. Although job growth has recently declined, the U.S. labor market continues its stretch of one of its strongest periods ever. The labor market is a key focus for the Federal Reserve, as the strength of the labor market affects consumer spending, which in turn affects the demand for products and services and consequently inflation.
Economic growth will likely decline in 2024, as third quarter 2023 economic growth was unsustainably strong at 4.9% and the Federal Reserve continues its focus on slowing the labor market to reduce consumer spending. The strength of the labor market will be a strong influence on any changes in 2024 interest rates. However, the overall strength of the current U.S. economy has bolstered confidence in weakened, rather than negative 2024 economic growth.
4. The Middle East
There is certainly no doubt the war raging in Israel and the Gaza strip has already taken an enormous human cost. The total economic cost, both in the region and globally, is yet to be determined. Any expansion of the war could cause uncertainty in oil market pricing, and the U.S. is part of the global oil market.
The invasion of Ukraine by Russia caused a significant increase in oil prices and consequently inflation. Hopefully a quick resolution is found, but a continued Middle East conflict increases the probability of the war expanding, and negative effects on energy prices, inflation, and global economic growth.
For further information:
- From the Federal Reserve:
- GDP Growth (and other national data) from the Bureau of Economic Analysis:
- Info from the Bureau of Labor Statistics:
- From Eurostat:
- From the Bank of Canada:
- Global Inflation, from rateinflation.com:
- From the Atlanta Federal Reserve:
- From Yahoo Finance:
- From the U.S. Treasury:
- Global Central Bank info:

Kevin Bahr is a professor emeritus of finance and chief analyst of the Center for Business and Economic Insight in the Sentry School of Business and Economics at the University of Wisconsin-Stevens Point.