2023 began with more pessimism than optimism for global economies and stock markets. Global inflation was rampant in 2022; as a result, central banks around the world began raising interest rates in an effort to battle inflation through lower economic growth and consumer demand. Stock prices reflect expectations of future corporate profitability, so higher interest rates with reduced economic growth did not bode well for global stock markets.
In the United States, in 2022 the Federal Reserve increased the fed funds rate seven times from a low of 0.00-0.25% to start the year to a targeted range of 4.25-4.50% by yearend. As a result of the aggressive increase, by late 2022 many economic forecasts for 2023 were hoping for a “soft landing” (weak economic growth) but an economic recession (negative economic growth for two or more consecutive quarters) seemed increasingly plausible. In fact, many well-respected forecasters like Jamie Dimon (CEO of JPMorgan Chase) were predicting a recession for 2023. In its December 2022 projections, the Federal Reserve expected economic growth of only 0.5% in 2023.
However, expectations don’t always match reality. Despite rapidly increasing interest rates and economic prognostications of weak economic growth at best, the U.S. economy in 2023 remained resilient with moderate economic growth and strong stock market performance. This blog will compare 2023 U.S. stock market performance with stock market performance around the world. A brief description of the selected stock market indexes used in the comparison is below.
United States (S&P 500)
- The S&P 500 Index is a diversified index that measures the stock performance of 500 leading, publicly traded companies in the U.S. It is a “large-cap” index, comprised of relatively large companies having a market capitalization (share price x total shares outstanding) exceeding $10 billion. The S&P 500 is designed to be a leading indicator of U.S. equities and is meant to reflect the risk/return characteristics of the large-cap universe across a broad range of industries. As a result, it is generally viewed as one of the best measures of the overall U.S. stock market.
Mexico (IPC)
- The Mexican Stock Exchange is the second largest stock exchange in Latin America (after Brazil) and its main index is the IPC. The Mexican IPC index measures the performance of leading companies listed on the Mexican Stock Exchange, and is comprised of a selection of shares that are representative of all the shares listed on the exchange from various sectors of the economy.
Canada (S&P/TSX Composite)
- The S&P/TSX Composite Index is the benchmark Canadian stock market index and generally viewed as the Canadian equivalent to the S&P 500 index in the United States. The index contains stocks of the largest companies on the Toronto Stock Exchange (TSX), and accounts for approximately 70% of the total market capitalization of the Toronto Stock Exchange.
United Kingdom (FTSE 100)
- The Financial Times Stock Exchange 100 Index, also called the FTSE 100 Index, is a share index of the 100 companies listed on the London Stock Exchange with the highest market capitalization. The index consists of blue-chip (large companies with high investment quality) stocks on the London Stock Exchange. The FTSE 100 is usually considered a leading indicator of profitability for companies in the United Kingdom and the U.K. economy in general. As a result, the FTSE 100 is often used as a proxy for the performance of the broader U.K. stock market similar to the way that many U.S. investors look to the S&P 500 index.
Germany (DAX)
- The DAX stock index measures the performance of the 40 largest companies that trade on the Frankfurt Exchange. The DAX is a German blue-chip stock market index that captures approximately 80% of the aggregate market capitalization that trades on the Frankfurt Exchange.
France (CAC 40)
- The CAC 40 index is widely used as the benchmark for French stock market performance. The index includes the 40 largest French stocks, based on market capitalization, that trade on the Euronext Paris exchange.
Japan (Nikkei 225)
- The Nikkei 225 Stock index is viewed as the leading and most-respected index for measuring the performance of Japanese stocks. The index is comprised of Japan’s top 225 blue-chip companies that trade on the Tokyo Stock Exchange.
Australia (S&P/ASX200)
- The S&P/ASX 200 Index is the benchmark stock market index in Australia, comprised of the 200 largest stocks that trade on the Australian stock exchange, based on the total dollar value of company stock that is available for trading.
China – (SSE and Hang Seng)
- A variety of indexes track the performance of Chinese stock markets in Shanghai, Beijing, Hong Kong, Shenzhen, and Taiwan. The Shanghai Stock Exchange is the second largest equity market in Asia behind Japan’s stock exchange. The Hong Kong Exchange is the third largest equity market in Asia. The Shanghai Stock Exchange (SSE) Composite Index provides a broad measure of the performance of companies listed on the Shanghai Stock Exchange. The index tracks all stocks traded on the exchange. The Hang Seng Index (HSI) is widely considered as the benchmark index for Hong Kong stocks and is viewed as a measure for Asian markets in general. It includes the largest companies that trade on the Hong Kong Exchange, covering approximately 65% of its total market capitalization.
The table below compares indexes for the one year and five-year annualized return for the period ending December 31, 2023.
Global Stock Market Performance of Selected Indexes
One-Year and Five-Year Returns (annualized) as of December 31, 2023
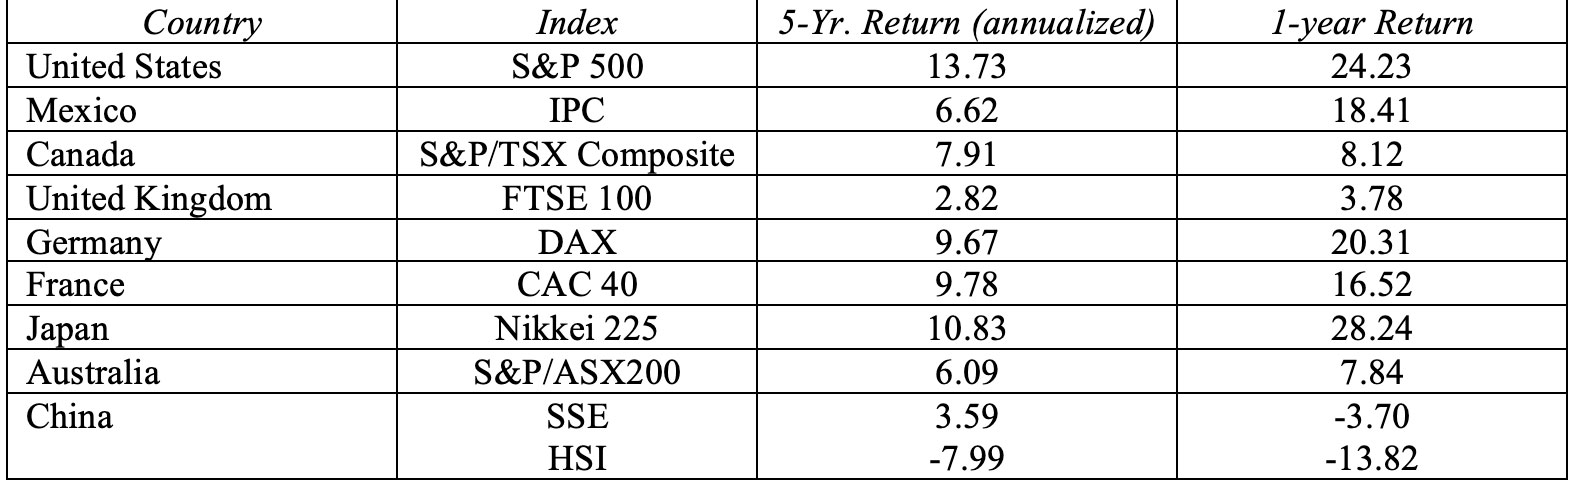
The U.S. stock market performed extremely well in 2023 and for the 5-year period ended December 31, 2023. Stock market performance in 2023 was a reflection of the relatively strong U.S. economy. The S&P 500 index increased 24.31 percent, more than twice the long-run average return on U.S. large-cap stocks. China’s stock returns reflect significantly lower economic growth in 2022 and 2023 relative to pre-COVID levels. For the selected indexes, the 1-year return ranged from a low of -13.82 percent for China’s HSI index to a high of 28.24 percent for Japan’s Nikkei 225 index. The U.S. S&P 500 ranked second.
For annualized returns over the 5-year period ended December 31, 2023, the U.S. S&P 500 index ranked first among the selected indexes, with an annualized return of 13.73 percent. The annualized return over the 5-year period ended December 31, 2023 ranged from a low of –7.99 percent for China’s HSI index to a high of 13.73 percent for the S&P 500.
The selected indexes are broad measures of stock market performance in their respective countries. In the U.S., the strength of the 2023 stock market is further evidenced by the performance of technology stocks. The NASDAQ Composite, an index comprised of over 2500 companies listed on the NASDAQ stock exchange and heavily weighted toward technology, increased a whopping 43.42%. The annualized return over the 5-year period ended December 31, 2023 was 17.74% for the NASDAQ.
2023 was an excellent year for U.S. stock market performance. As any reputable investment firm will tell you, past performance is no guarantee of future results. However, the significant decline in inflation that occurred in 2023 and expected interest rate cuts by the Federal Reserve bode well for the 2024 U.S. economy and stock market.
For further information:
- Yahoo! Finance: World Indices
- Morningstar: Morningstar Empowering Investors

Kevin Bahr is a professor emeritus of finance and chief analyst of the Center for Business and Economic Insight in the Sentry School of Business and Economics at the University of Wisconsin-Stevens Point.