Republican presidential candidate Donald Trump has indicated that he would place a 10% tariff on all products imported into the United States if elected president, with potential tariffs of up to 60% on goods imported from China. This blog will discuss recent tariffs, trade, and the potential impact of a 10% (at least) blanket tariff on all imported goods.
Trade Overview
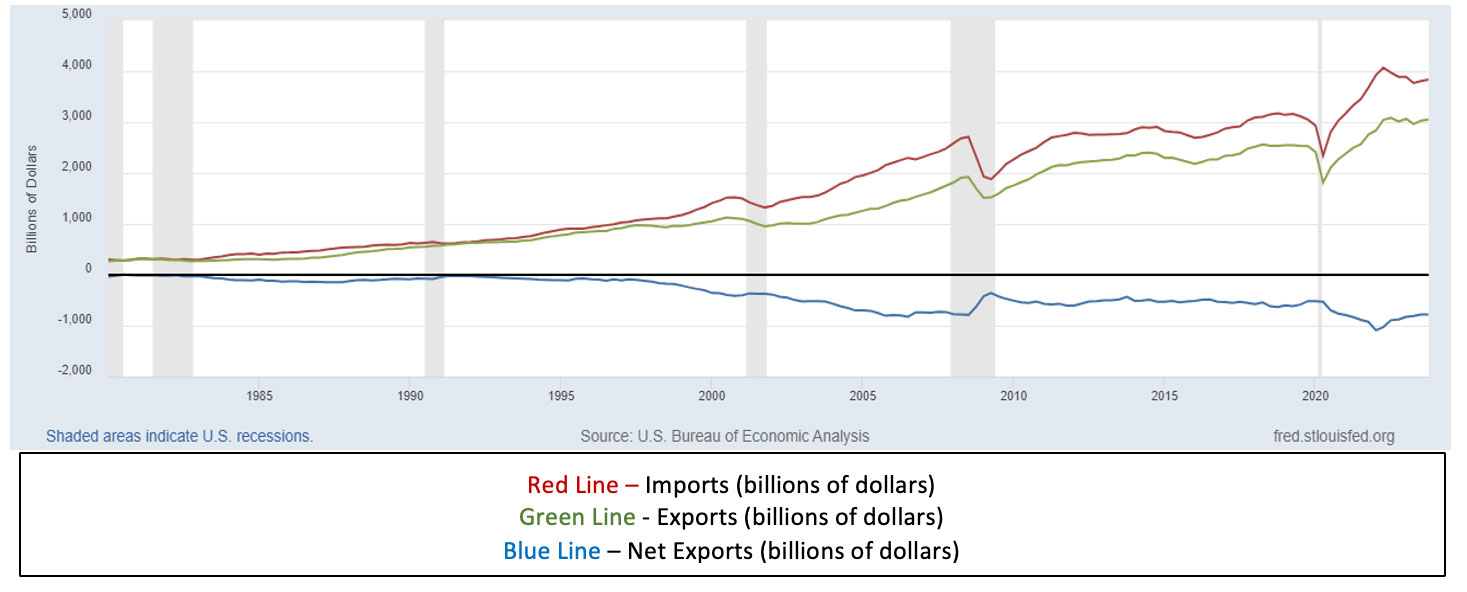
First, a quick long-term overview on trends in U.S. international trade. Chart 1 below shows U.S. imports, exports, and net exports of goods and services from 1980 – 2023. Net exports are defined as the exports of U.S. goods and services to other countries minus the imports of goods and services from other countries to the U.S. In other words, it shows the U.S. trade balance of goods and services with all countries. The red line represents imports, the green line exports, and the blue line net exports.
Beginning in 1980, the United States has consistently had negative net exports (a trade deficit), meaning that the value of imports has exceeded the value of exports in every year since 1980. The shaded areas of the chart indicate recession periods. Net exports will generally decrease (the trade deficit will lessen) during recessions, as U.S. corporations and consumers buy less from abroad, meaning fewer goods and services will be imported. The United States has the largest economy in the world, which contributes to strong consumer demand for imports. Global trade began ramping up in the 1980s, and exports and imports have generally increased since, with exceptions occurring during global economic downturns.
In 2022 both imports and exports were at record levels as global economies recovered from the pandemic. U.S. exports hit a record $3.08 trillion in the third quarter of 2022 while imports peaked at $4.07 trillion in the second quarter. The trade deficit hit an all-time high of nearly $1.1 trillion in the first quarter of 2022, as the post-pandemic U.S. economy recovered more robustly and quickly than other economies, causing a surge in U.S. consumer related imports as consumer spending increased and businesses restocked inventories. The trade deficit declined in 2023, with fourth quarter net exports at $781 billion. Both exports and imports were down slightly from 2022 record highs. For the fourth quarter of 2023, exports were $3.05 trillion while imports totaled $3.83 trillion.
Chart 1: U.S. Imports, Exports, and Net Exports of Goods and Services 1980-2023
(Billions of dollars)
Recent History – Tariffs
In 2018 and 2019, the Trump administration initiated a wave of tariffs between the U.S. and several countries, with a focus on imports from China. According to the Congressional Budget Office, by January 2020 the United States had imposed tariffs on 16.8 percent of goods imported into the country. Some tariffs applied to imports of specific products from nearly all U.S. trading partners, including tariffs on washing machines, solar panels, and steel and aluminum products. However, some countries were exempted from certain tariffs. Canadian and Mexican imports were granted exemptions from the tariffs on steel and aluminum products. China was the main focus, with tariffs affecting over half of U.S. imports from China, targeting intermediate goods (items used for the production of other goods and services), capital goods (such as computers and other equipment), and some consumer goods (such as apparel).
In response to the tariffs, U.S. trading partners retaliated by imposing their own trade barriers. As of early 2020, retaliatory tariffs had been imposed on 9.3 percent of all goods exported by the United States, which consisted primarily of industrial supplies and materials as well as agricultural products.
While tariffs increase revenues for the U.S. government, it is important to note who pays the tariffs. U.S. corporations choosing to import pay the tariff, not any country that exports to the U.S. The tariff acts like a tax on importing corporations, who can then choose to pass the cost to consumers. In effect, the tariff is a tax on businesses and consumers. According to the U.S. Treasury, tariffs have provided only between 1% and 2% in federal government revenue since 2015.
U.S. tariff rates peaked in 2019. The weighted mean applied tariff is the average of effectively applied rates weighted by the product import shares corresponding to each partner country. According to the World Bank, the U.S. mean applied tariff rate increased from 1.59% in 2018 to 13.78% in 2019 before declining to 1.52% in 2020.
Changes in Trade in Goods with Top Trading Partners since 2017
The recent tariffs, combined with increasing political tensions with China, have had a major impact on sourcing by U.S. firms since 2017. Table 1 below shows the 2023 U.S. top trading partners in goods (excluding services), while Table 2 shows the 2017 top trading partners in goods. Table 3 shows the change in exports and imports with the top trading partners between 2017 and 2023.
Table 1: 2023 U.S. Top Trading Partners in Total Trading of Goods (billions of dollars)
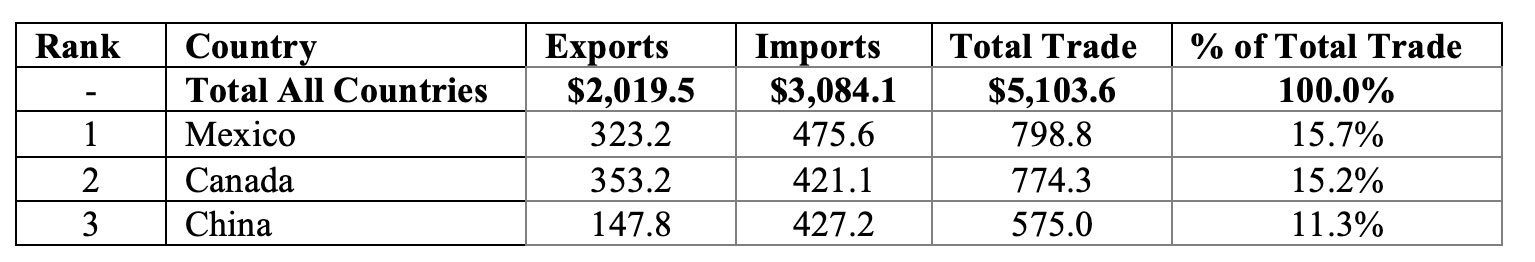
Table 2: 2017 U.S. Top Trading Partners in Total Trading of Goods (billions of dollars)
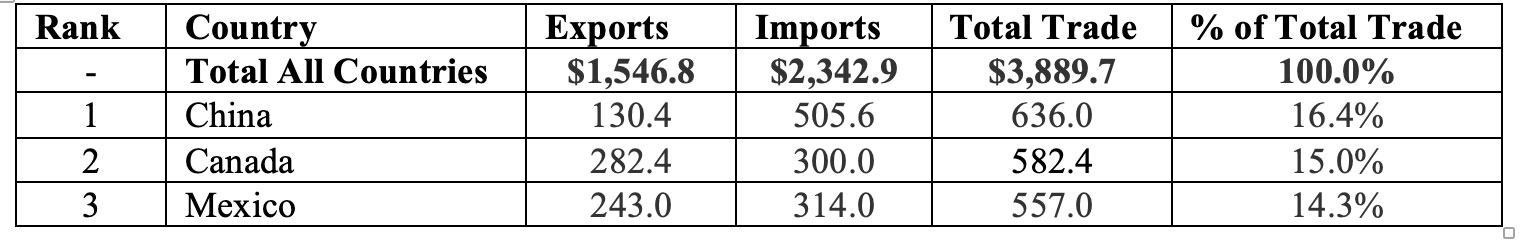
Table 3: Changes in Exports and Imports with Top Trading Partners (billions of dollars)
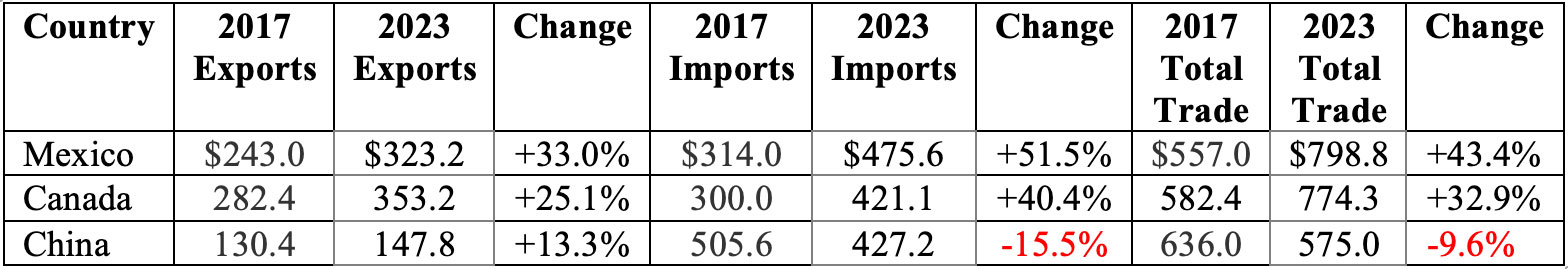
In both 2017 and 2023, the top three trading partners in goods with the U.S. were Mexico, Canada, and China. However, the ranking of trading partners changed, with Mexico rising from third to first and China falling from first to third. In 2023, the top trading partner in goods for the U.S. was Mexico, comprising 15.7% of total trade with $798.8 billion. Total trade with Mexico increased 43.4% from 2017, with exports increasing 33.0% to $323.2 billion and imports rising 51.5% to $475.6 billion. Canada was second with total trade of $774.3 billion in 2023, an increase of 32.9% from 2017. Exports rose 25.1% to $353.2 billion while imports increased 40.4% to $421.1 billion. Total trade with China decreased 9.6% from 2017 to $575 billion in 2023. The decline in trade was caused by a drop of 15.5% in imports from China since 2017 to $427.2 billion in 2023, while exports increased 13.3% to $147.8 billion.
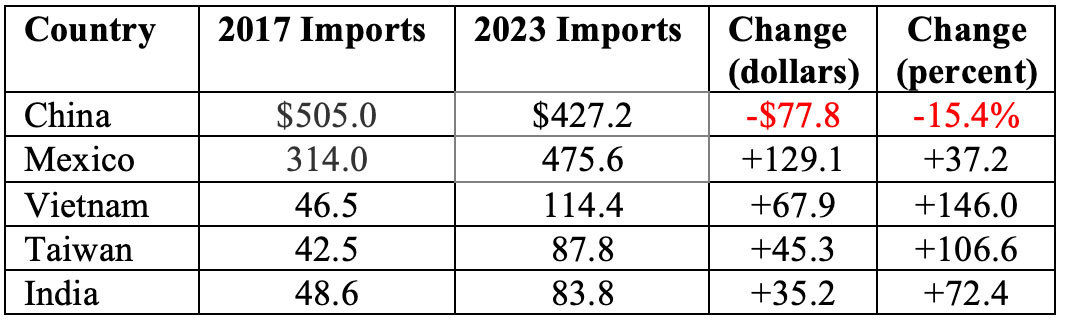
U.S. companies focus on maximizing profitability. The tariffs implemented in 2018, particularly for China, caused many companies to turn away from China for sourcing toward other low labor cost countries. Table 4 below shows the changes in imports of goods with selected low labor cost countries between 2017 and 2023. Imports from China declined $78.4 billion, or 15.5%, while imports from other low labor cost countries surged as the increased tariffs caused U.S. companies to resource imports. On a percentage increase basis, Vietnam was the big winner, with U.S. imports from Vietnam increasing 146.0% since 2017 to $114.4 billion in 2023. In terms of dollars, imports from Mexico increased the most. Between 2017 and 2023, imports rose $129.1 billion, a 37.2% increase since 2017.
Table 4: Changes in Imports of Goods with Selected Low Labor Cost Countries (billions of dollars)
Manufacturing Employment
One of the objectives of the tariffs initiated in 2018 was bringing manufacturing jobs back to the U.S. Despite the 2018 tariffs on Chinese imports and reductions in corporate taxes that included incentives for business investment, the restoration of U.S. manufacturing jobs generally that didn’t happen. Resourcing of products occurred through switching sourcing from China to another low labor cost country rather than transferring manufacturing to the U.S.
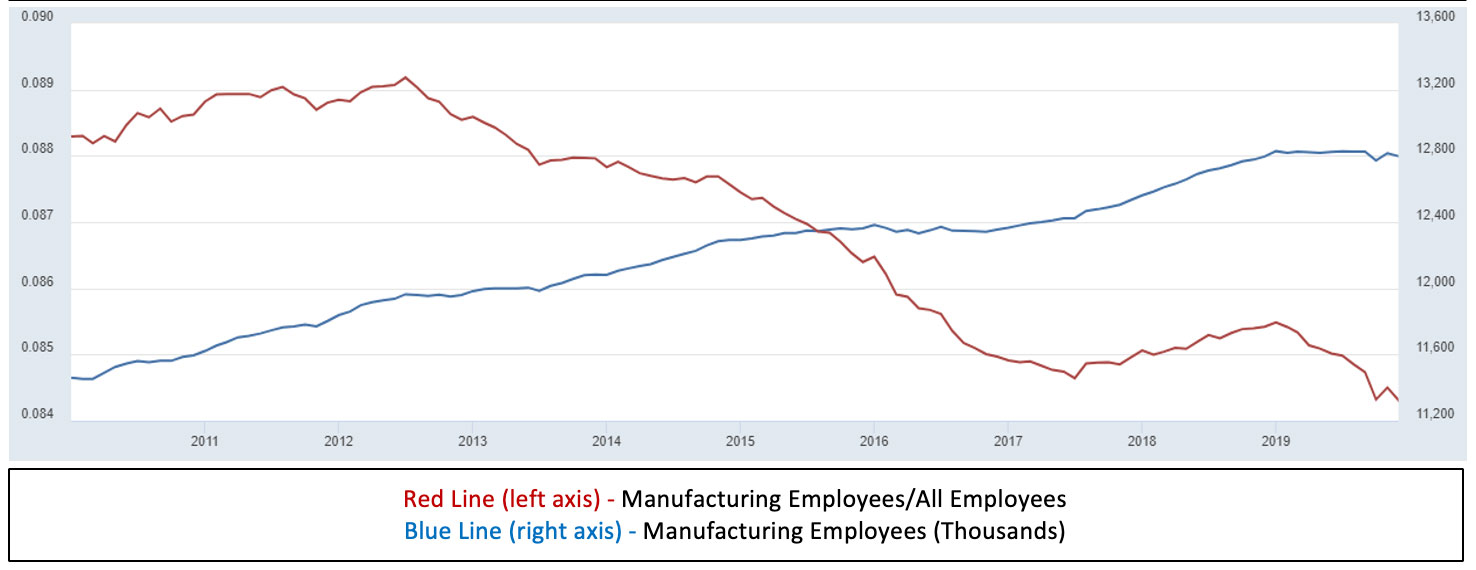
Chart 2 below focuses on what happened to manufacturing during the economic expansion between 2010 and 2019. The blue line indicates the number of employees in manufacturing from 2010 through 2019. After hitting a low of 11.5 million in early 2010, manufacturing employment steadily grew to 12.8 million in December 2019. Manufacturing employment generally grew each year throughout the entire decade, with only 2016 and 2019 having relatively unchanged manufacturing employment. Despite the growth in manufacturing employment during the economic expansion, the manufacturing sector ended the decade with approximately 1 million fewer employees than what it had before the financial crisis. Manufacturing employment was 12.8 million in December 2019, an approximate 6.5% drop from the October 2007 level of 13.8 million.
The red line in Chart 2 indicates the number of employees in manufacturing divided by total non-farm employment from 2010 through 2019 – the percentage of people employed in the manufacturing sector. The decade began with manufacturing employment comprising 8.8% of total employment; the decade ended with manufacturing employment comprising only 8.4% of total employment. That compares to manufacturing employment comprising 10.0% of total employment in October 2007.
Chart 2: Manufacturing Employment and Manufacturing Employment as Percentage of Total Employment 2010-2019
So, during the economic expansion of the last decade employment in the manufacturing sector increased – just like employment in most sectors of the economy. Total manufacturing employment grew, but so did total employment in the economy. Manufacturing employment increased from 11.5 million to 12.8 million in the decade but was 6.5% lower than the 13.8 million manufacturing employment in October 2007 as the financial crisis began. Manufacturing employment was relatively unchanged in 2019. As a percentage of total employment, manufacturing employment decreased from a high of 8.9% in 2012 to 8.4% by the end of 2019. This compares to manufacturing employment comprising 10.0% of total employment in October 2007 before the onset of the financial crisis.
Consequences of a 10% (at least) Tariff on all Imports
A blanket 10% tariff on all imports (probably more for Chinese imports) would likely have the following consequences:
- Increased Inflation. Tariffs are a tax on businesses and consumers. Tariffs are initially paid for by corporations with the probability that the cost will be passed onto consumers. The tariffs implemented in 2018, particularly for China, could at least be partially circumvented by turning away from China and sourcing from another low labor cost country which had little, if any tariffs. The 10% tariff blanket would take away low-cost sourcing options, as every import option faces a tariff of at least 10%. The increased tariffs would increase prices. Recent cost increases for corporations caused by global inflation and supply shortages were generally more than passed through to consumers. According to the U.S. Bureau of Economic Analysis, corporate profit margins hit a 70-year high in 2022 while profits were at record levels.
- Tariff Retaliation. Similar to what happened in 2018, no doubt countries would place retaliatory tariffs on U.S. products. This would hurt the competitiveness of U.S. exporters and possibly cause job losses for U.S. exporters.
- Lower Economic Growth. Relative to not having a 10% blanket tariff, economic growth will be lower as business and consumers pay higher prices and exporters lose business as U.S. competitiveness declines due to retaliatory tariffs.
- Increased Chinese Economic Leadership. The decoupling of America from global trade would present an opportunity for China to reenergize its economy by filling the vacuum left by America in global trade. No doubt, China would try and capitalize on the increased costs of American goods (due to tariff retaliation) and try to replace American exports with Chinese exports globally.
- Negative Impact on Financial Markets. The increased costs for businesses and consumers would reduce foreign trade and foreign opportunities for U.S. businesses. This would have a negative effect on equity markets as corporate profitability is reduced. The tariffs could also adversely affect credit markets. Foreign investment into the U.S. often results from U.S. imports. Any reduction in demand for U.S. Treasury securities would put upward pressure on interest rates.
- Increased labor market pressures. The U.S. labor market has been extremely strong, with unemployment below 4.0% since February 2022, the longest monthly streak of sub 4.0% unemployment since the 1960s. More Americans were working in 2024 than ever before. The 2018 tariffs were ineffective at increasing American manufacturing as lower cost alternatives existed. The 10% tariff blanket makes lower cost labor countries less attractive. However, bringing jobs back to America would be challenging. The labor market is tight, recent “labor shortages” have occurred, and wage increases have outpaced inflation. Unless the labor force is increased, finding workers to fill jobs resulting from transitioning from foreign sourcing would likely be challenging. Pressures in the labor market would likely result in further price increases for consumers.
- Tariffs being used as a Political/Economic Tool. In the 2018 and 2019 tariffs, specific exclusions were granted to certain products and countries. Exemptions to the blanket 10% tariff could potentially occur due to political or economic reasons.
For further information:
- From the Tax Foundation:
- From CNBC:
- From the Wall Street Journal:
- From the U.S. Census:
- From Investopedia:
- From the Congressional Budget Office:

Kevin Bahr is a professor emeritus of finance and chief analyst of the Center for Business and Economic Insight in the Sentry School of Business and Economics at the University of Wisconsin-Stevens Point.