The U.S. economy has been the subject of much discussion with differing viewpoints. This report will hopefully shed light on U.S. economic performance by analyzing a broad range of economic variables over the period from January 2017 through March 2024. Changes in these variables, as well as the reasons why these variables changed, will be discussed. Since 2021, the labor market, the stock market, and economic growth have been excellent, while inflation, interest rates, and the housing market created challenges.
The Labor Market
Since 2021, the U.S. labor market has been extremely strong based on a variety of measures, including job growth, total employment, the unemployment rate, and manufacturing employment. The strong labor market has been driven by consumer spending which accounts for approximately two-thirds of economic growth. Consumer spending has benefited from economic expansion, government fiscal programs and consistent job growth since January 2021.
Job Growth
The table below shows monthly and total annual job growth from January 2017 through March 2024, and the ranking of years by total job growth. 2021, 2022, and 2023 were ranked 1, 2, and 3, respectively, for annual job growth over the period 2017 through 2023. The last month with job losses was December 2020. Since then, every month from January 2021 through March 2024 posted job gains.
The job growth in 2021 was at least partially related to the massive job losses in 2020 due to the pandemic. Total employment had peaked in February 2020 at nearly 152.4 million, but the onslaught of COVID caused total employment to fall to only 130.4 million in April, a loss of nearly 22 million jobs in two months. Employment growth rapidly increased with the economic rebound beginning in May, but by the end of the year the economic rebound had run out of steam. Job gains were reduced each month beginning in July, with job losses occurring in December 2020. After peaking at 14.8% in April, the unemployment rate steadily declined but was still at 6.7% in December.
2020 was the worst year for jobs this century, with job losses of 9.2 million for the year. 2021 and 2022 were the top two years for job growth this century, with 7.2 and 4.5 million jobs added, respectively.
The job growth in 2021 was at least partially due to the low total employment caused by the pandemic in 2020 and the return to a more normal economy in 2021. The nearly 7.3 million jobs added in 2021 reduced the unemployment rate from 6.4% in January to only 3.9% in December. The job growth in 2022 and 2023 was particularly impressive as significant job gains continued despite the growth that already occurred in 2021.
The 7.5 million jobs added for the two years of 2022 and 2023 exceeded the 6.4 million jobs added over the three-year period 2017-2019. Job growth continued in the first quarter of 2024, with over 800,000 jobs added.

One Month Net Change in Employment
Total Employment
More Americans were working in March 2024 than ever before. The total number employed was not only a recent high, it was a historical high. Since June 2022, each successive month has resulted in a record number of Americans working. In June 2022 total employment surpassed the February 2020 pre-pandemic historical high.
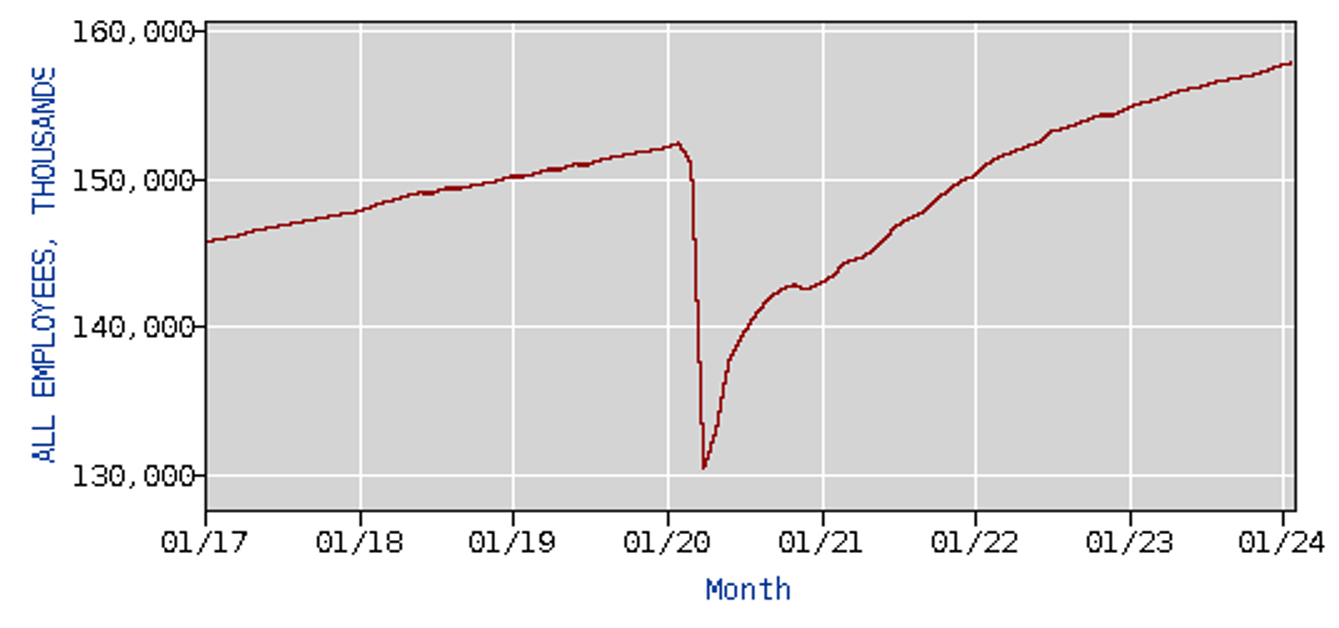
The chart below shows total employment (in thousands) since January 2017. Approximately 158.1 million Americans were employed in March 2024, an increase of nearly 28 million workers since the April 2020 COVID low of 130.4 million. Almost 6 million more Americans were working in March 2024 than the pre-pandemic high of 152.3 million in February 2020.
Total Employees (in thousands), January 2017 – March 2024
Source: U.S. Bureau of Labor Statistics
Manufacturing employment is often viewed as a key benchmark for the labor market, as manufacturing jobs are generally higher paying and manufacturing of certain products is vital to the strategic interests of the United States. Manufacturing employment increased slightly from 12.366 million in January 2017 to 12.828 million in January 2019, an increase of 3.7%. However, manufacturing employment in 2019 was relatively unchanged. Despite economic growth, significant corporate tax breaks from the 2018 tax bill, and tariffs and trade wars, manufacturing employment ended the year at 12.798 million, a slight decline from the beginning of the year. The economic contraction caused by COVID in 2020 caused a significant decline in manufacturing employment. Manufacturing employment fell to only 11.419 million in April 2020, dropping over 1.3 million since December 2019. Although manufacturing employment began to rebound in May, it was only at 12.194 million in December 2020, a decline of nearly 5% from the 12.798 million in December 2019.
Growth in manufacturing employment returned in 2021 with the post-COVID economic rebound. Between January 2021 and March 2024, manufacturing employment increased from 12.188 million to 12.956 million in March 2024, an increase of approximately 6.3% and nearly 800,000 jobs. In 2024, manufacturing employment was at its highest level since the financial crisis of 2008.
Unemployment Rate
The table below shows the unemployment rate from January 2017 through March 2024. After starting the period at 4.7% in January 2017, the unemployment rate steadily declined to 3.5% in September 2019 and hovered between 3.5% and 3.6% until an upward shift due to COVID in March 2020. In April 2020 the unemployment rate hit a record high 14.8%, which surpassed the previous high of 10.8% in 1982. The economic recovery began in May, and the unemployment rate declined to 6.7% in November. However, the economic recovery stalled in December 2020 as job losses returned and the unemployment rate remained steady at 6.7%.
The economic rebound returned with job gains and a declining unemployment rate in January 2021. The unemployment rate gradually declined and hit a low of 3.4% in both January and April of 2023, the lowest it had been since 1969. The unemployment rate was below 4.0% from February 2022 through March 2024. The streak of 26 consecutive months with an unemployment rate below 4.0% was the longest monthly streak since the late 1960s.

Real Wage Growth
Strong wage growth and declining inflation has contributed to real wages increasing since February 2023, as wage growth has exceeded inflation. The chart below shows the 3-month moving average of median hourly wage growth (red line) relative to the annualized inflation rate (blue line) as measured by the Consumer Price Index since 2017. Wage growth outpaced inflation between January 2017 and March 2021, continuing a trend that began in May 2012. Between April 2021 and January 2023 inflation exceeded wage growth; consequently, real wages declined. However, the trend reversed in early 2023, and real wages have increased as the growth in hourly wages has exceeded the rate of inflation since February 2023.
3-Month Moving Average of Median Wage Growth, Hourly Data (red line)
Annualized Inflation Rate, Consumer Price Index (blue line)
January 2017 – March 2024
Sources: Federal Reserve Bank of Atlanta, Bureau of Labor Statistics

Stock Market Performance
The U.S. stock market has been on a roll. In the past five years, 401ks have done extremely well.
2023 began with more pessimism than optimism for global economies and stock markets. Global inflation was rampant in 2022; as a result, central banks around the world, including the Federal Reserve, began aggressively raising interest rates in an effort to battle inflation through lower economic growth and consumer demand. Stock prices reflect expectations of future corporate profitability, so higher interest rates with reduced economic growth did not bode well for global stock markets.
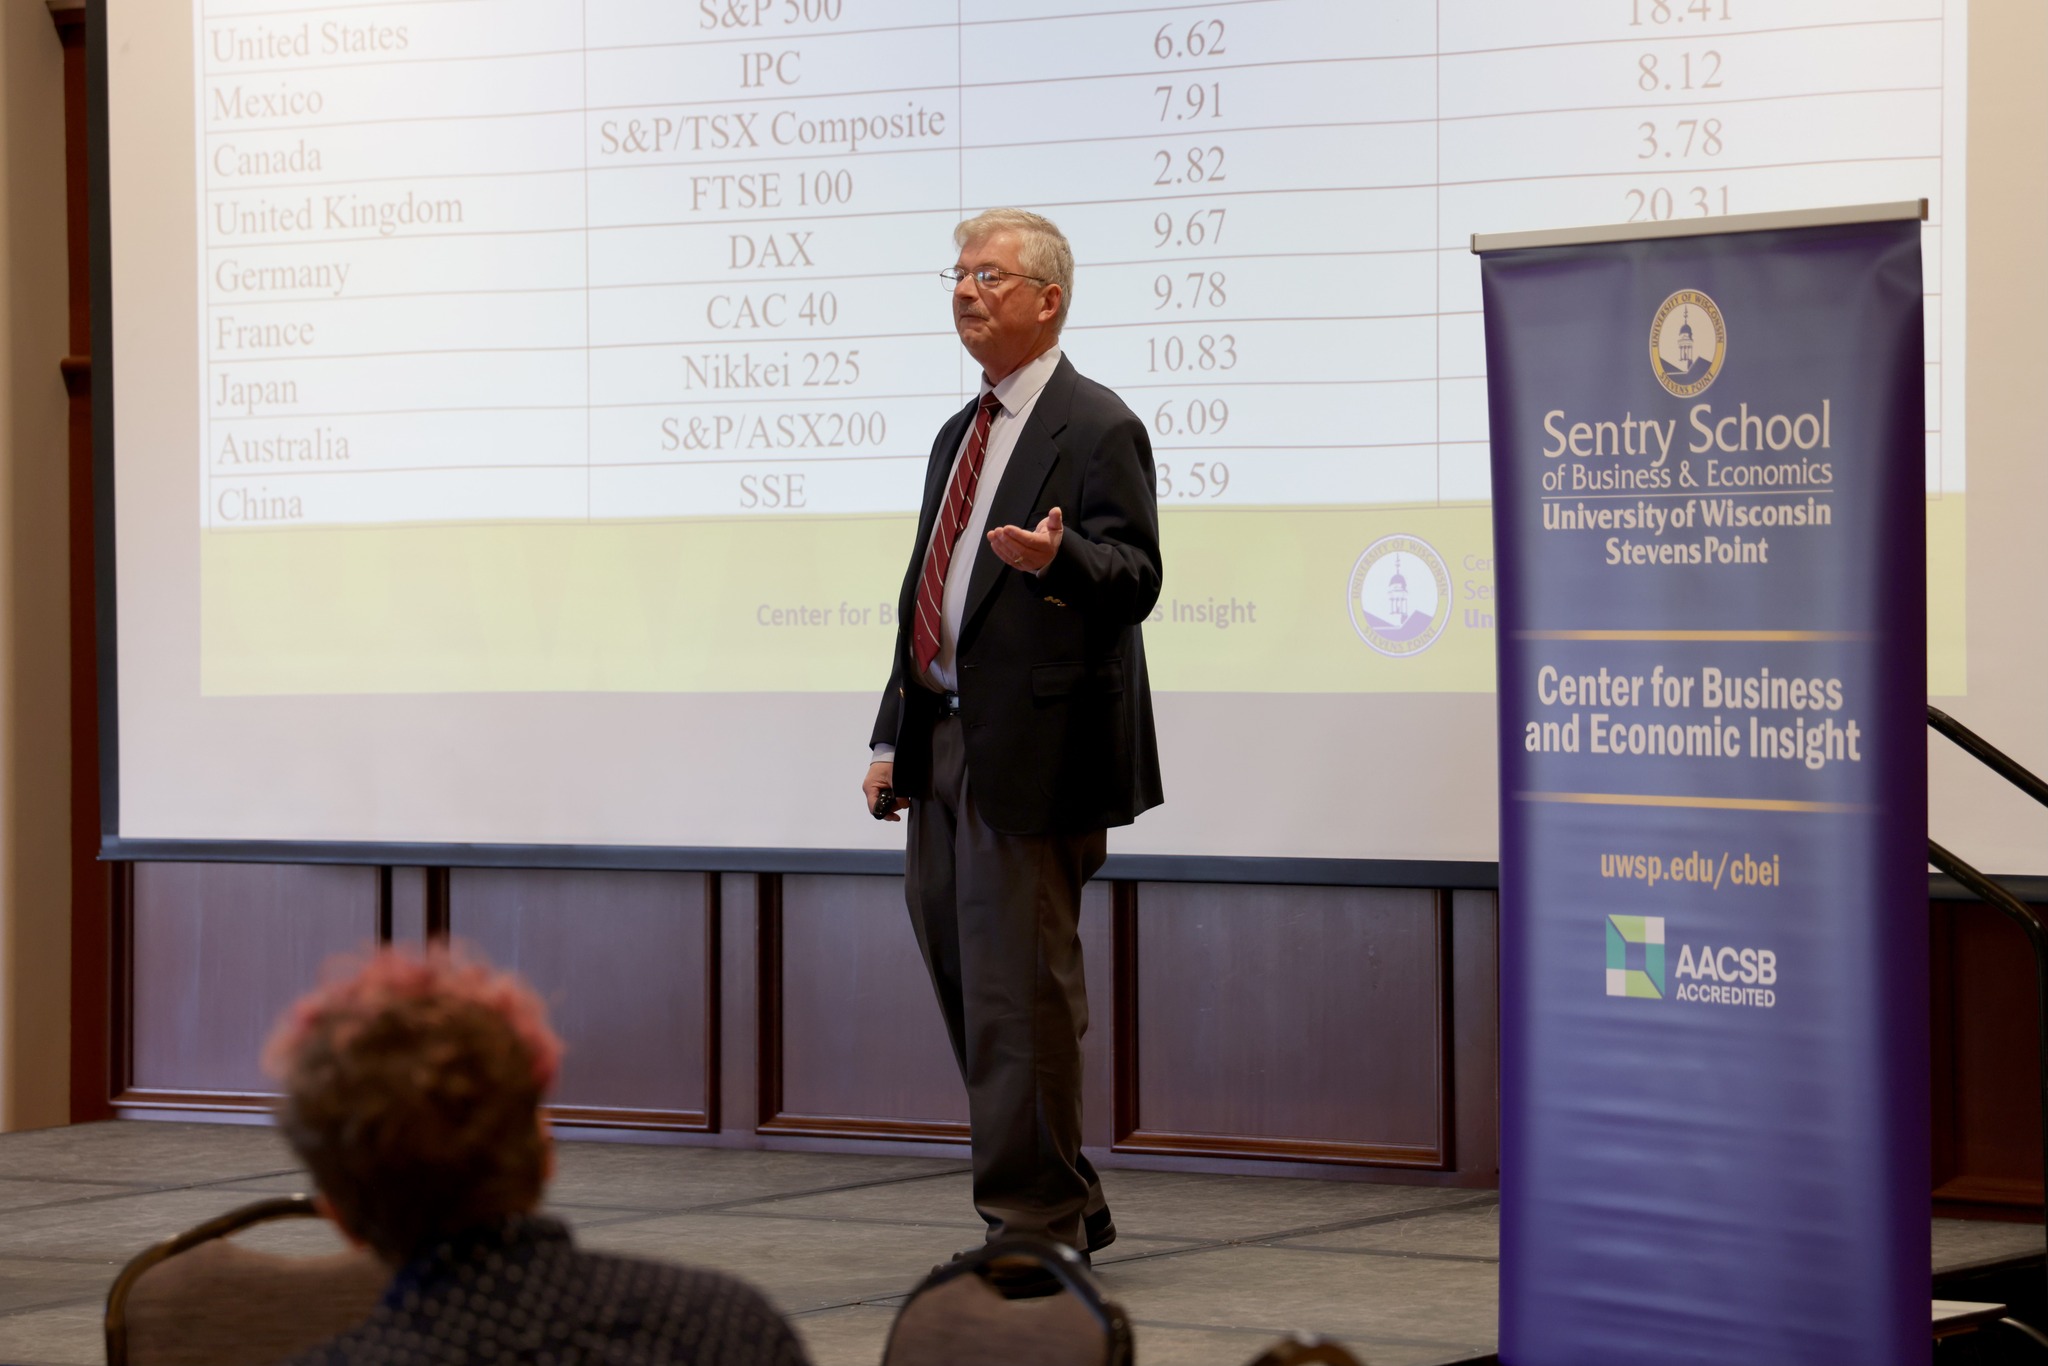
However, despite rapidly increasing interest rates and economic prognostications of weak economic growth at best, the U.S. economy in 2023 remained resilient with moderate economic growth and strong stock market performance. The table below compares indexes for the one year and five-year annualized return for the period ending December 31, 2023 for major stock market indexes around the world. The selected indexes are broad measures of stock market performance in their respective countries. The U.S. S&P 500 is a benchmark index for U.S. large company (large-cap) stocks.

The U.S. stock market performed extremely well in 2023 and for the 5-year period ending December 31, 2023. Stock market performance in 2023 was a reflection of the relatively strong U.S. economy. The S&P 500 index increased 24.2 percent, more than twice the long-run average return on U.S. large-cap stocks. For annualized returns over the 5-year period ending December 31, 2023, the U.S. S&P 500 index ranked first among the selected indexes, with an annualized return of 13.7 percent.
In the U.S., the strength of the 2023 stock market is further evidenced by the performance of technology stocks. The NASDAQ Composite, an index comprised of over 3000 companies listed on the NASDAQ stock exchange and heavily weighted toward technology, increased a whopping 43.42%. The annualized return over the 5-year period ending December 31, 2023 was 17.74% for the NASDAQ.
Although financial markets do not like uncertainty, the U.S. stock market remained resilient in the first quarter of 2024 with both the S&P 500 and NASDAQ achieving record highs as economic growth continued. However, plenty of uncertainty remains for equity markets, including the U.S. election, interest rates, and global conflicts.
Economic Growth
Economic growth is measured by changes in Gross Domestic Product (GDP), which is the value of goods and services produced in a given time period. After the economic decline in 2020, U.S. economic growth rebounded and included surprisingly strong growth in 2023, contributing to the what was arguably the strongest global economy.
The chart below shows the percentage change in GDP between the fourth quarter of 2023 relative to the fourth quarter of 2019 for G7 countries. The United States had GDP growth of 8.2 percent, almost doubling the GDP growth of Canada, which ranked second.
G7 Percentage Change in GDP Since Pre-Pandemic Level
4th Qtr. 2023 vs. 4th Qtr. 2019
Source: OECD; UK House of Commons

The table below shows how changes in the four components of Gross Domestic Product (GDP) contributed to the change in U.S. economic growth since 2017.
Although rising interest rates slowed the economy in the first half of 2023 relative to the second half of 2022, moderate economic growth of 2.2% and 2.1% occurred in the first and second quarter, respectively. Third quarter economic growth was exceptionally strong at 4.9%. While investment spending fluctuated with rising interest rates, personal consumption remained robust and was the primary driver of economic growth in 2023. Economic expansion continued in the first quarter of 2024 with the economy growing at 1.6%, with personal consumption once again the primary factor driving economic growth. Personal consumption accounts for approximately two-thirds of GDP, and personal consumption has been the key, consistent, driver of economic growth during the economic recovery, contributing positively to GDP growth since the third quarter of 2020.

Inflation
Global inflation has declined significantly since peaking in 2022; however, global inflation rates remain higher than desired. The table below shows the annual inflation rate for Europe, the United Kingdom, Canada, Australia, Mexico and the United States from 2017 through March 2024. Although there are regional differences, note that the trends in inflation are similar across most countries, with relatively low inflation between 2017 and 2019 and a drop in inflation in 2020 due to the global COVID economic contraction. Inflation picked up in 2021 and peaked in 2022 before declining in 2023. The trends are similar across countries because global factors have impacted global prices. Near record or record levels of inflation were recorded for the United States, the Euro Area, Canada, and the United Kingdom in 2022.
Global inflation increased in 2021 as supply chain problems appeared and global oil prices began rising due to the economic recovery. Those factors peaked in 2022, and included price spikes in global energy and food prices related to Putin’s invasion of Ukraine and lingering supply chain issues which contributed significantly to inflation.
Russia is a leading global exporter of oil, and oil prices spiked from approximately $75 a barrel in late December 2021 to almost $120 a barrel in June 2022 after the Russian invasion of Ukraine in February caused great uncertainty in global oil markets. The increased oil prices not only affected global energy costs, but also transportation costs for goods worldwide, both key factors contributing to global inflation. The Russian invasion of Ukraine also had a significant impact on food prices. Russia and Belarus comprise nearly 20 percent of the global export market share of all fertilizers, and global fertilizer prices rose to record levels in 2022. The Russian invasion of Ukraine triggered import-export restrictions that compounded supply problems. Wheat prices spiked 50% in early 2022, as wheat exports were disrupted by the war. (Russia and Ukraine accounted for approximately 30% of global wheat exports prior to the war.) Supply chain disruptions, exemplified by the semiconductor chip shortage, became prominent in 2021 and continued into 2022. Between April 2021 and July 2022, new vehicle prices in the U.S. increased nearly 16% with sales declining by over 26%.
In 2023, the mitigation of these global factors led to a significant decline in inflation throughout the world. After peaking at nearly $120 a barrel in June 2022, oil prices were approximately $75 a barrel in June 2023. The October 2023 price of wheat declined nearly 50% from its peak in February 2022. Supply chain problems also generally improved as global economies recovered from the pandemic.
Another factor that contributed to price increases for U.S. consumers – record corporate profits and profit margins. A measure of U.S. corporate profit margins tracked by the Federal Reserve was recently at levels not seen since the early1950s, indicating that the increased prices charged by businesses exceeded their increased costs for production and labor. After-tax profits as a share of gross value added for non-financial corporations, a measure of aggregate profit margins, exceeded 15% in both 2021 and 2022, the highest level since the early 1950s. In the fourth quarter of 2023, corporate profits were approximately double what they were in the fourth quarter of 2019.
The chart below demonstrates how inflation has been a global problem. Note the trends in inflation are generally similar across countries. The mitigation of global factors that contributed to inflation are reflected by the significant decline in inflation that has generally occurred around the world since 2022. However, inflation in 2024 has remained above desired levels. In the United States, over half the inflation in March was due to energy and shelter (housing).

Food Inflation
Perhaps no other price increases affected consumers as much as food inflation. You can’t avoid buying food – the increase in food prices can play a significant role in consumers feeling about how they are doing economically. In the United States, food prices rose significantly from 2019 to 2023; however, food inflation was significant around the world.
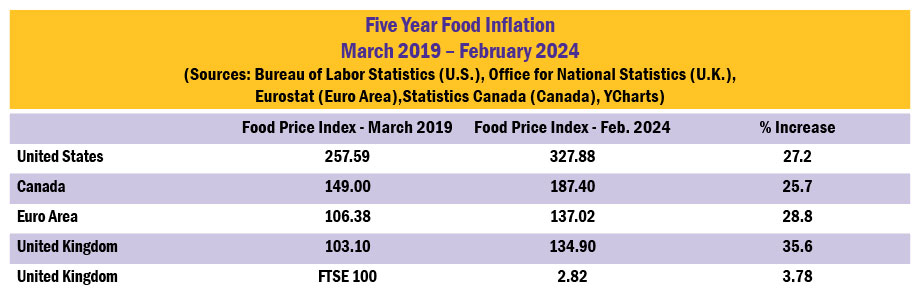
The table below shows five-year food inflation over the period March 2019 through February 2024 for the United States, Canada, the Euro Area, and the United Kingdom. The food price index increase was 27.2% for the United States, compared to 25.7% for Canada, 28.8% for the Euro Area, and a whopping 35.6% for the United Kingdom. Once again although there are regional and climate differences, global factors affected the general trends in food prices similarly between countries.
There is some good news regarding U.S. food inflation – the rate of food inflation has been steadily declining since August 2022. The chart below shows the annualized rate of food inflation from March 2023 to February 2024. The annualized rate for food inflation has steadily declined from 8.5% in May 2023 to 2.2% in February 2024. The 2.2% was the lowest rate for food inflation in almost three years, matching the rate in May 2021. The monthly change in food at home prices for February and March was 0.00%.
U.S. Food Inflation (Annualized) March 2023 – February 2024
Source: Bureau of Labor Statistics; Trading Economics

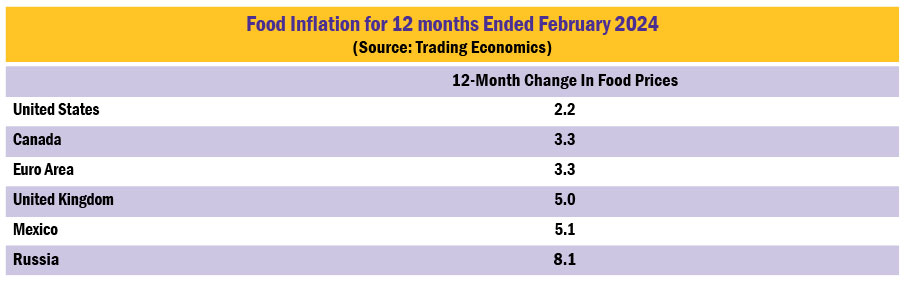
The chart below shows food inflation for the 12-month period ended February 2024. On a comparative basis, U.S. food inflation was lower than other countries.
Food inflation is particularly hard on consumers. Putin’s invasion of Ukraine drove fertilizer and commodity prices to record levels, climate factors, the largest avian flu outbreak in history, supply chain issues, industry concentration, and labor shortages all contributed to record food inflation around the world. However, many of those factors have been mitigated, and food inflation, particularly in the United States, has declined significantly.
In the future, what happens to food prices will be driven by global factors and domestic policies that affect the supply and production of food. If elected, Trump has indicated implementation of a new 10% minimum tariff on all imports which would negatively affect food prices. In addition, there is the ongoing saga of immigration. Immigrants have played an important part in food supply. Labor shortages would drive grocery prices even higher.
Interest Rates
Theoretically, the Federal Reserve acts in an independent manner to balance economic growth with inflation. The Federal Reserve tries to accomplish this goal through targeting the “fed funds rate” – a very short-term interest rate that when changed, typically has a rippling effect through the financial markets. The Federal Reserve influences this rate by primarily controlling the money supply in the United States. The amount of money circulating in the economy has an impact on interest rates and credit conditions – more money, lower interest rates; less money, higher interest rates. The federal funds rate is increased when the Federal Reserve decreases the money supply by selling Treasury securities (technically called Open Market Operations).
After a series of seven interest rate cuts, the Federal Reserve brought the fed funds rate to a then record low of 0.00-0.25% in 2008 to help the economy rebound from the financial and economic crisis. The record low fed funds rate remained until 2015, when the Federal Reserve began slowly raising interest rates due to concerns that the economy would overheat with unemployment approaching 5.0% in late 2015.
The chart below shows the federal funds rate since 2017. Seven interest rate increases occurred in 2017 and 2018 to temper potential inflationary pressures resulting from continued economic growth, the tax cuts of 2018, and the unemployment rate dropping below 4.0%. The fed funds rate started 2017 at 0.50-0.75%; by the end of 2018, the Federal Reserve had increased the rate to 2.25-2.50%.
The Federal Reserve reversed policy in 2019 with three interest rate cuts primarily due to concerns over an economic slowdown resulting from trade wars and tariffs. In 2018 and 2019, the U.S. initiated a wave of tariffs between the U.S. and several countries. Although the main focus was on China, tariffs were also placed on goods from several countries, including Canada, Mexico, India, South Korea, and the European Union. According to the Congressional Budget Office, by January 2020 the United States had imposed tariffs on 16.8 percent of goods imported into the country. In response to the tariffs, U.S. trading partners retaliated by imposing their own trade barriers. As of early 2020, retaliatory tariffs had been imposed on 9.3 percent of all goods exported by the United States, which consisted primarily of industrial supplies and materials as well as agricultural products. U.S. tariff rates peaked in 2019. The weighted mean applied tariff is the average of effectively applied rates weighted by the product import shares corresponding to each partner country. According to the World Bank, the U.S. mean applied tariff rate increased from 1.59% in 2018 to 13.78% in 2019 before declining to 1.52% in 2020.
Federal Reserve policy in 2020 was driven by the expected devastating impact of COVID on the economy. Two interest rate cuts in March returned the fed funds rate to its historical low of 0.00 – 0.25%. The Federal Reserve kept the fed funds rate at its historical low that, when combined with fiscal policy, helped spur an economic rebound.
In 2022 the focus of the Federal Reserve, and central banks around the world, shifted to increasing interest rates to fight inflation. In March 2022, the Federal Reserve began the upward trek for interest rates, with eleven rate increases occurring through November 2023. The objective of the rate increases was to lower consumer and business spending, which in turn would lower inflation through reduced demand for products and services. Although global factors outside the control of central banks were the primary drivers of recent inflation, the Federal Reserve and other central banks focused on lowering inflation through reduced demand for products and services.
In September 2023, the European Central Bank raised interest rates by a quarter of a percentage point to 4%, the highest level ever since the launch of the euro currency in 1999. The European Central Bank raised interest rates at ten consecutive meetings before pausing in October 2023. The Canadian central bank gradually raised its policy interest rate from 1.5% in June 2022 to 5.0% in July 2023 before pausing interest rate hikes. The Bank of England began raising its bank rate from 0.10% in November 2022 to 5.25% in August 2023 before ending rate hikes. Australia’s central bank gradually raised interest rates from 0.10% in April 2022 to 4.35% in December 2023. Inflation was a global problem; central banks around the world raised interest rates to decrease interest rate sensitive consumer and business spending. An exception to rising interest rates has been China, which has reduced interest rates to counter sluggish economic growth.
Although global inflation has generally remained above desired levels, the potential for interest rate cuts remains in 2024. The CME FedWatch Tool provides insight as to what the financial markets expect for interest rates based on fed funds futures pricing. As of late April, the financial markets indicate that there is an approximate 60% chance that the fed funds rate will be reduced by at least 25 basis points by September. However, any future interest rate cuts are subject to changing economic conditions.
Effective Federal Funds Rate January 2017 – March 2024
Source: Federal Reserve Board

The Housing Market
It’s been difficult for anyone looking to buy a new home to be able to afford it. Rising interest rates combined with increasing home prices have made home affordability challenging.
Housing prices skyrocketed between the first quarter of 2020 through the fourth quarter of 2022. The quarterly median sales price increased approximately 46%. The percentage increase in prices over those three years nearly matched the percentage increase that occurred over the entire last decade. Between the first quarter of 2010 and the fourth quarter of 2019, the quarterly median sales price increased approximately 47%. The main culprit in causing housing prices to increase significantly is the lack of inventory, which declined significantly in 2020 and has remained relatively low.
The chart below shows the housing inventory (number of listings) and the median sales price for houses since January 2017. The housing inventory is indicated by the blue line (left axis); the median sales price for houses is indicated by the red line (right axis).
Housing Inventory, Number of Active Listings (blue line)
Median Sales Prices of Houses Sold (red line)
Sources: Census, HUD, Realtor.com through Federal Reserve Economic Database (FRED)

Despite relatively low mortgage rates, housing prices remained relatively level from January 2017 through December 2019 as strong demand was met by high levels of home listings. Housing prices began to surge in 2020 as home inventory (active listings) plummeted. Between the second and fourth quarters of 2020, housing prices rose over 11%. Although mortgage rates began a significant rise in early 2022 as the Federal Reserve began the upward trek for interest rates, housing prices continued to climb as home inventory remained low. Finally, in early 2023, home prices fell as home inventories rose and mortgage rates continued upward. Part of the reason that the Federal Reserve began increasing interest rates in 2022 was to stabilize the housing market by lowering demand through higher financing costs.
While tax credits for homebuyers and incentives for home builders could improve the housing market, that would require bipartisan Congressional legislation – not likely in the current political environment.
Oil Production and Gas Prices
The volatility of gas and energy prices has played a significant role in global and U.S. inflation.
Oil production, and total energy production, have reached record levels in the United States this decade. In 2023, oil production rose to its highest level ever in the United States. According to the U.S. Energy Information Administration, when all sources of energy are considered, including petroleum, natural gas, renewable energy, coal and nuclear power, total annual energy production has exceeded total annual energy consumption since 2019. In addition, since 2019, the United States has been a net exporter of energy, and since 2020 the United States has been a net exporter of petroleum products.
The chart below shows U.S. monthly production of crude oil from January 2017 through December 2023. Oil production in the years 2017 through 2019 continued the trend that began with the economic recovery following the financial crisis of 2008. U.S. oil production increased as economic growth returned. Between 2009 and 2019, U.S. oil production increased each year. For the decade, U.S. oil production more than doubled, growing from 5.4 million barrels per day in January 2010 to nearly 13 million barrels per day in December 2019.
However, in early 2020, U.S. oil production decreased by approximately 25%, from 12.8 million barrels per day in January to only 9.7 million barrels per day in May. Why? The market price of oil drastically dropped from approximately $65 per barrel in December 2019 to nearly $25 per barrel in April 2020 as the demand for oil decreased due to the economic shock caused by COVID. When oil prices tank then oil profits decline, and there is much less incentive for oil production. In 2020, the oil industry had one of its worst years ever as oil prices sank, with many companies reporting losses for the year including ExxonMobil and Shell.
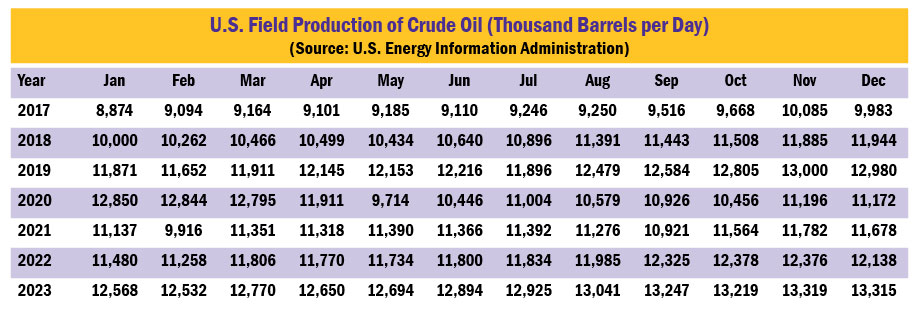
As the economy began to recover in 2020, oil prices rose and generally so did oil production. Oil prices rose due to increased global energy demand and low inventory levels that resulted from production cuts in 2020. However, the December 2020 oil production was still nearly 14% below the level of production in December 2019.
Oil prices rose gradually in 2021 before peaking at $83 per barrel in October and declining to $75 per barrel by December. Oil production rose approximately 5%, ending the year at 11.7 million barrels per day in December compared to 11.2 million barrels per day in December 2020.
In 2022 oil prices skyrocketed as Putin invaded Ukraine, rising from $75 at yearend 2021 and peaking at nearly $120 in June before dropping to around $80 in December. The price decline was due to increasing economic uncertainty as global interest rates rose to combat inflation. It’s a balancing act for oil companies, as oil prices are affected by supply, demand and other global factors. The major focus of oil companies is to maximize profits and returns for shareholders. Increasing output may increase revenues and profits; however, increasing the supply of oil can also lower global oil prices and consequently lower profits. The volatility of the oil market, an expected economic slowdown, and plummeting oil prices in 2020 created a cautious environment for increasing production in 2022. However, in 2022 the focus on maximizing profits led to record company and industry profits, which included ExxonMobil and Shell reporting their highest quarterly earnings ever.
In 2023, economic concerns subsided as U.S. economic growth continued surprisingly strong, which contributed to oil production in the United States rising to its highest level ever. Oil production exceeding 13 million barrels per day began in August and continued through December.
Although U.S. oil production has been strong, U.S. gas prices are primarily driven by the global price of oil. The chart below shows the relationship between the global price of oil (blue line, left axis) and U.S. gas prices (red line, right axis). Note the strong relationship in pricing. When the global price of oil increases, U.S. gas prices generally increase. When the global price of oil decreases, U.S. gas prices decrease. The global price of oil is influenced by many factors, including U.S. and global production levels, supply chain disruptions (including wars), global economic growth, and economic and political uncertainties (such as Middle East military conflicts). Whatever affects the global price of oil will likely affect prices paid by Americans at the pump. Since 2021, the global price of oil has generally been greater than the pre-COVID price.
Brent Crude Oil Price (blue line, left axis) and U.S. Regular Gas Price (red line, right axis)
Sources: U.S. Energy Information Administration, IMF

For further information:
- Info from the Bureau of Labor Statistics:
- From the Federal Reserve:
- GDP Growth (and other national data) from the Bureau of Economic Analysis: GDP Growth
- From Eurostat: Euro Area Inflation
- From the Bank of Canada: Canadian Inflation
- Global Inflation, from rateinflation.com
- From the Atlanta Federal Reserve: Wage Growth Tracker
- Global Central Bank info:
- CME FedWatch Tool: CME Fed Funds Futures
- Food Prices: Trading Economics U.S. Food Inflation
- From the U.S. Energy Information Administration:
- From the U.K. House of Commons: GDP – International Comparisons: Key Economic Indicators

Kevin Bahr is a professor emeritus of finance and chief analyst of the Center for Business and Economic Insight in the Sentry School of Business and Economics at the University of Wisconsin-Stevens Point.