The U.S. economy continued to roll along in the first half of 2024. Economic growth continued, inflation decreased and the labor market was relatively strong. The strong economic performance was reflected by record stock market performance. The U.S. S&P 500 index (a benchmark index for U.S. large company stocks) and the NASDAQ index (technology index) rose to record highs in the first half of 2024. Challenges, however, remain for the U.S. economy. Election uncertainty and concomitant potential policy ramifications could dampen economic and financial market performance. Despite rising interest rates, housing prices hit new highs as the supply (number of listings) of homes continued to be significantly lower than pre-COVID levels. Although job growth continued in every month through July, the prolonged period of job growth (since January 2021) combined with the ramp-up of interest rates by the Federal Reserve led to an inevitable cooling of the labor market, with decreasing job growth and an increasing unemployment rate in the second quarter. July job growth was less than expected, which increased economic uncertainty and caused stock markets to decline. However, the slowing labor market has significantly raised the probability of an interest rate cut by the Federal Reserve in September. This blog will review the performance of key economic variables in the first half of 2024.
Economic Growth
Economic growth is measured by changes in Gross Domestic Product (GDP), which is the value of goods and services produced in a given time period. After declining 2.2% in 2020, U.S. economic growth returned in 2021 and has continued since. The economy rebounded strongly in 2021 and grew at a 5.8% rate before slowing to 1.9% in 2022, as the Federal Reserve began the upward trek of interest rates. In 2022 the focus of the Federal Reserve, and central banks around the world, shifted to increasing interest rates to fight inflation. The objective of the rate increases was to lower consumer and business spending, which in turn would lower inflation through reduced demand for products and services. Although global factors outside the control of central banks were the primary drivers of recent inflation, the Federal Reserve and other central banks focused on lowering inflation by reducing the demand for products and services. Seven interest rate increases occurred in 2022, followed by four more increases in 2023. Despite the rate increases, the U.S. economy grew at a surprisingly strong 2.5% annual rate in 2023, contributing to the what was arguably the strongest global economy. After slowing in the first quarter of 2024 to 1.4%, economic growth rebounded to a robust 2.8% in the second quarter.
The table below shows how changes in the four components of Gross Domestic Product (GDP) contributed to the change in U.S. economic growth since the first quarter of 2023.
Contributions to Percent Change in Real Gross Domestic Product – Annualized Rate

Rising interest rates slowed the economy in the first half of 2023, with moderate economic growth of 2.2% and 2.1% in the first and second quarter, respectively. Surprisingly strong economic growth returned in the third and fourth quarters, with economic growth of 4.9% and 3.4%, respectively. While investment spending fluctuated with rising interest rates, personal consumption remained robust and was the primary driver of economic growth in 2023. Personal consumption accounts for approximately two-thirds of GDP, and personal consumption has been the key and consistent driver of economic growth during the economic recovery, contributing positively to GDP growth since the third quarter of 2020.
After cooling to 1.4% in the first quarter of 2024, economic growth was impressive at 2.8% in the second quarter. Importantly, both personal consumption and investment spending (including business investment in equipment and inventories) made significant contributions to economic growth. Since 2021, economic growth has remained solid, despite prognostications of an economic recession. Significantly, second quarter 2024 featured strong contributions to economic growth by both consumer and business sectors. Despite increasing interest rates since early 2022, economic growth has remained solid.
Inflation
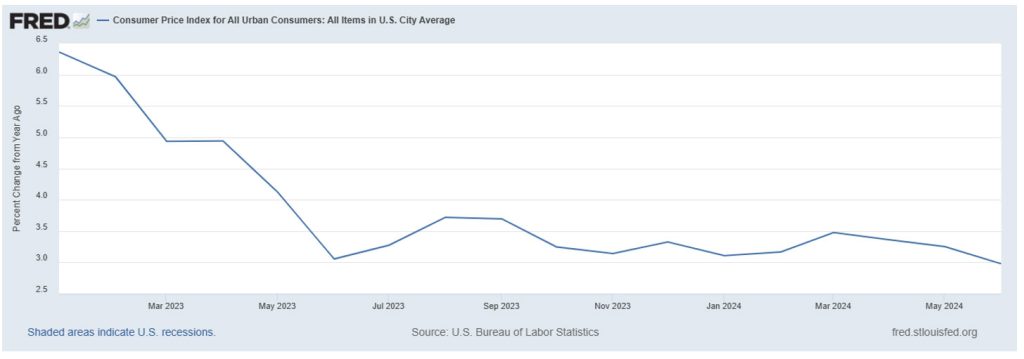
Global inflation, including inflation in the United States, has declined significantly since peaking in 2022. The graph below shows the annualized U.S. inflation rate since January 2023, as measured by the twelve-month change in the Consumer Price Index. Generally, inflation has consistently declined from the 6.4% rate in January 2023 to 3.0% in June 2024.
Percent Change in Consumer Price Index from One Year Ago
January 2023 – June 2024

The table below shows the annual inflation rate for Europe, the United Kingdom, Canada, Australia, Mexico and the United States from 2019 through June 2024. Although there are regional differences, note that the trends in inflation are similar across most countries with relatively low inflation in 2019 and a drop in inflation in 2020 due to the global COVID economic contraction. Inflation picked up in 2021 and peaked in 2022 before declining in 2023.
Global Inflation Rates 2019 – June 2024

*Inflation rate for 12 months ended June 2024
The trends in inflation are similar across countries because global factors impacted global prices. Near record or record levels of inflation were recorded for the United States, the Euro Area, Canada and the United Kingdom in 2022. Global inflation increased in 2021 as supply chain problems appeared and global oil prices began rising due to the economic recovery. Those factors peaked in 2022, with price spikes in global energy and food prices linked to Putin’s invasion of Ukraine and lingering supply chain issues which contributed significantly to inflation. The mitigation of global factors that contributed to inflation are reflected by the significant decline in inflation that has generally occurred around the world since 2022. In the United States, the primary factors contributing to inflation in 2024 were energy and shelter (housing).
The Labor Market
Since 2021, the U.S. labor market has been strong based on a variety of measures, including job growth, total employment, and the unemployment rate. Although job growth continued in every month through July, the prolonged period of job growth (since January 2021) combined with the ramp-up of interest rates by the Federal Reserve led to an inevitable cooling of the labor market, with decreasing job growth and an increasing unemployment rate in the second quarter. Although job growth continued in July, it was less than expected, leading to increased economic uncertainty. Despite solid economic growth in the first half of 2024, increasing interest rates slowed the labor market. Since 2021, the labor market has been driven by consumer spending which accounts for approximately two-thirds of economic growth. Consumer spending has benefited from economic expansion, government fiscal programs and consistent job growth since January 2021.
Job Growth
The United States has had job growth every month since January 2021. The last month with job losses was December 2020. Since then, every month from January 2021 through July 2024 posted job gains.
The table below shows monthly and total annual job growth from January 2020 through July 2024.
One Month Net Change in Employment and Total Annual Change (in thousands)
January 2020– July 2024

2020 was the worst year for jobs this century, with job losses of over 9.2 million for the year. 2021 and 2022 were the top two years for job growth this century, with 7.2 and 4.5 million jobs added, respectively.
The job growth in 2021 was at least partially due to the low total employment caused by the pandemic in 2020 and the return to a more normal economy in 2021. The nearly 7.3 million jobs added in 2021 reduced the unemployment rate from 6.4% in January to only 3.9% in December. The job growth in 2022 and 2023 was particularly impressive as significant job gains continued despite the growth that already occurred in 2021.
The 7.5 million jobs added for the two years of 2022 and 2023 exceeded the 6.4 million jobs added over the three-year period 2017 – 2019. In 2024, job growth continued in every month through July, with approximately 1.4 million jobs added to the economy. It’s been a long-run for job growth. As of July, job gains were recorded in 43 consecutive months. The combination of the prolonged period of job growth, combined with rising interest rates, inevitably led to a slowing of the job market that began in the second quarter. The preliminary July job growth was 114,000 jobs, less than the 175,000 expected. The shortfall caused quite a stir in financial markets, as fears of an economic slowdown increased and stock markets declined.
Total Employment
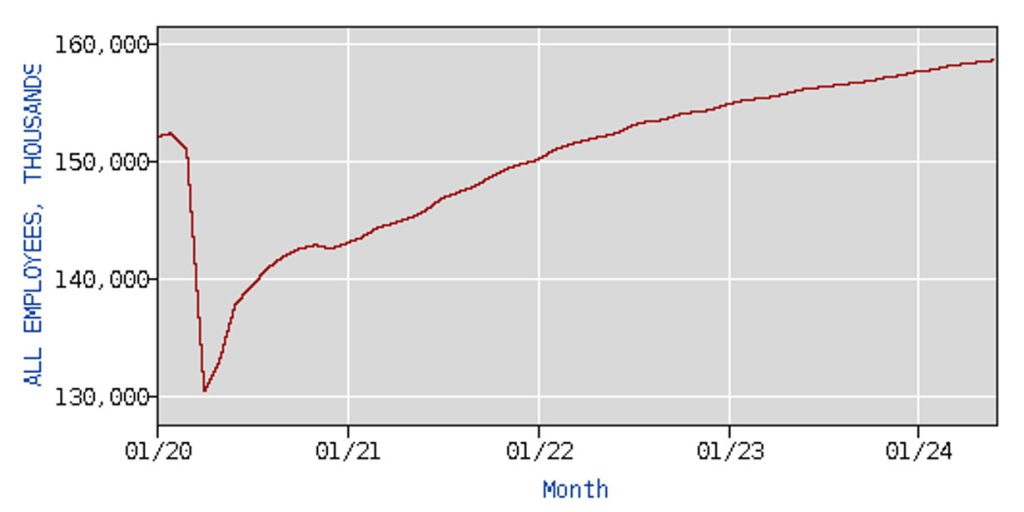
The consistent job growth that has occurred since January 2021 meant that more Americans were working in July 2024 than ever before. Since June 2022, each successive month has resulted in a record number of Americans working. In June 2022 total employment surpassed the February 2020 pre-pandemic historical high. The chart below shows total employment (in thousands) since January 2020. Approximately 158.7 million Americans were employed in July 2024, an increase of over 28 million workers since the April 2020 COVID low of 130.4 million. Over 6 million more Americans were working in July 2024 than the pre-pandemic high of 152.3 million in February 2020.
Total Employees (in thousands), January 2020– July 2024

Unemployment Rate
The table below shows the unemployment rate from January 2020 through July 2024. After starting the year at 3.6%, in April 2020 the unemployment rate hit a record high 14.8%, which surpassed the previous high of 10.8% in 1982. The economic recovery began in May, and the unemployment rate declined to 6.7% in November. However, the economic recovery stalled in December 2020 as job losses returned and the unemployment rate remained steady at 6.7%.
The economic rebound returned with job gains and a declining unemployment rate in January 2021. The unemployment rate gradually declined and hit a low of 3.4% in both January and April of 2023, the lowest it had been since 1969. The unemployment rate was below 4.0% from February 2022 through April 2024. The streak of 27 consecutive months with an unemployment rate below 4.0% was the longest monthly streak since the late1960s. Although job gains occurred in every month in 2024, the unemployment rate increased and rose to 4.3% in July, reflecting a slowing labor market as well as increased labor force participation.
Unemployment Rate January 2017 – July 2024

Interest Rates
Federal Reserve policy in 2020 was driven by the expected devastating impact of COVID on the economy. Two interest rate cuts in March returned the fed funds rate to its historical low of 0.00–0.25%. The Federal Reserve kept the fed funds rate at its historical low that, when combined with fiscal policy, helped spur an economic rebound.
In 2022 the focus of the Federal Reserve, and central banks around the world, shifted to increasing interest rates to fight inflation. In March 2022, the Federal Reserve began the upward trek of interest rates, with eleven increases through November 2023. From a historic low of 0.00-0.25%, the fed funds rate hit 5.25-5.50% in July 2023. The objective of the rate increases was to lower consumer and business spending, which in turn would lower inflation through reduced demand for goods and services even though global factors were the primary drivers of inflation.
In September 2023, the European Central Bank raised interest rates by a quarter of a percentage point to 4%, the highest level ever since the launch of the euro currency in 1999. The European Central Bank raised interest rates at ten consecutive meetings before pausing in October 2023. The Canadian central bank gradually raised its policy interest rate from 1.5% in June 2022 to 5.0% in July 2023 before pausing interest rate hikes. The Bank of England began raising its bank rate from 0.10% in November 2022 to 5.25% in August 2023 before ending rate hikes. Australia’s central bank gradually raised interest rates from 0.10% in April 2022 to 4.35% in December 2023. Inflation was a global problem; central banks around the world raised interest rates to decrease interest rate sensitive consumer and business spending.
The demise of global inflation led to some central banks reversing course in 2024. The Canadian central bank reduced their policy interest rate by 25 basis points in June and July. The European Central Bank cut interest rates by 25 basis points in June. The Bank of England reduced their target interest rate by 25 basis points on August 1. Although global inflation has generally remained above a general 2% desired level, the significant decline in inflation holds the potential for global interest rate cuts in 2024. At its July meeting, the Federal Reserve left the door open for a rate cut in September; the financial markets are expecting it. The CME FedWatch Tool provides insight as to what the financial markets expect for interest rates based on fed funds futures pricing. As of early August, the financial markets anticipate that there is a 99% chance that the fed funds rate will be cut in September, with a 75% chance of a 50-basis point reduction. Any future interest rate cuts, however, are always subject to changing economic conditions.
Mid-Year Economic Summary
The U.S. economy continued to roll along in the first half of 2024. Economic growth remained resilient, with strong second quarter GDP growth of 2.8%, twice the growth of the first quarter. The stock market hit new highs. The labor market was strong on several fronts. More Americans were working in July 2024 than ever before. Jobs were added to the economy in every month since January 2021 and real wages have increased since February 2023. Inflation, globally and in the U.S., decreased significantly. However, a disappointing July jobs report increased economic uncertainty and negatively impacted stock markets. The preliminary July job growth was 114,000 jobs, less than the 175,000 expected.
After 11 rate increases since 2022, the Federal Reserve seems poised to cut interest rates in September. A slowing labor market will likely make the Federal Reserve finally follow the course of other major central banks, with an interest rate cut expected in September.
There are also other economic challenges in addition to the labor market. Election uncertainty, with potential policy ramifications, could dampen economic and financial market performance. The housing market remains challenging for home buyers, with elevated interest rates increasing financing costs and a continued supply strain which propelled home prices to record highs in 2024. Housing supply declined significantly in early 2020, and rising interest rates have contributed to monthly listings being approximately 30-50% lower than pre-COVID levels. Hopefully the expected interest rate cut in September by the Federal Reserve will create a more favorable home buying environment.
Despite the labor market slowdown in July, economic growth was solid in the first half of 2024. Hopefully fears of an economic slowdown will not be a self-fulfilling prophecy.
For further information:
- Info from the Bureau of Labor Statistics:
- From the Federal Reserve:
- GDP Growth (and other national data) from the Bureau of Economic Analysis:
- From Eurostat:
- From the Bank of Canada:
- Global Inflation, from rateinflation.com:
- From the Atlanta Federal Reserve:
- Global Central Bank info:
- CME FedWatch Tool

Kevin Bahr is a professor emeritus of finance and chief analyst of the Center for Business and Economic Insight in the Sentry School of Business and Economics at the University of Wisconsin-Stevens Point.
