
This blog will provide one last look at the economy before the 2024 presidential election. The topics covered include interest rates and the Federal Reserve, global and U.S. inflation, the labor market, economic growth, the stock market, and the housing market.
Interest Rates and the Federal Reserve
In September, the Federal Reserve finally provided a long-awaited interest rate cut, as the fed funds rate was decreased 50 basis points to a target range of 4.75%-5.00%. The Federal Reserve influences interest rates in the U.S. economy through targeting the “fed funds rate” – a very short-term interest rate that when changed, typically has a rippling effect through the financial markets. Changing the fed funds rate will affect mortgage rates, credit and borrowing rates, and savings rates. The fed funds rate is lowered to stimulate economic growth through increased consumer and business spending, as borrowing costs are reduced. The demise of global inflation led central banks around the world to cut interest rates in 2024.
In 2022 the focus of the Federal Reserve, and central banks around the world, shifted to increasing interest rates to fight inflation. In March 2022, the Federal Reserve began the upward trek of interest rates, with eleven increases through November 2023. From a historic low of 0.00-0.25%, the fed funds rate hit 5.25-5.50% in July 2023. The objective of the rate increases was to lower consumer and business spending, which in turn would lower inflation through reduced demand for goods and services even though global factors were the primary drivers of inflation.
Central banks around the world were generally in tandem with the Federal Reserve, increasing interest rates to combat global inflation. The European Central Bank raised interest rates at ten consecutive meetings before pausing in October 2023. In September 2023, the European Central Bank raised interest rates to 4%, the highest level ever since the launch of the euro currency in 1999. The Canadian central bank gradually raised its policy interest rate from 1.5% in June 2022 to 5.0% in July 2023 before pausing interest rate hikes. The Bank of England began raising its bank rate from 0.10% in November 2022 to 5.25% in August 2023 before ending rate hikes. Australia’s central bank gradually raised interest rates from 0.10% in April 2022 to 4.35% in December 2023. Inflation was a global problem; central banks around the world raised interest rates to decrease interest rate sensitive consumer and business spending.
The significant decline of global inflation led central banks to reverse course in 2024 with interest rate cuts. The September rate decrease by the Federal Reserve follows interest rate cuts by the central banks of Europe, Canada and England. In 2024, the Canadian central bank reduced their policy interest rate three times, with 25 basis point reductions in June, July and September. The European Central Bank cut interest rates twice, with 25 basis point cuts in June and September. The Bank of England reduced their target interest rate by 25 basis points on August 1.
Although some politicians have accused the Federal Reserve of being politically motivated in cutting interest rates, it wasn’t. The Federal Reserve is required by law to direct its policies toward the dual mandate of achieving maximum employment and price stability. The September interest rate cut was driven by the significant decline in inflation and a cooling of the U.S. labor market. Interest rate cuts also occurred prior to the 2020 election. In 2019, the Federal Reserve cut interest rates three times as economic growth slowed. In 2020, two interest rate cuts returned the fed funds rate to its historical low of 0.00-0.25% in an effort to counter the effects of COVID on the economy. In 2020 and 2024, the state of the economy drove Federal Reserve actions, not politicians.
At its September meeting, the Federal Reserve indicated that more interest rate cuts are possible in 2024 and 2025. Any future interest rate cuts, however, are always subject to changing economic conditions.
The next time the Federal Reserve will meet to discuss interest rate changes is Wednesday, November 6, the day after the 2024 Presidential election. The CME FedWatch Tool provides insight as to what the financial markets expect for interest rates based on fed funds futures pricing. As of mid-October, the financial markets anticipate that there is approximately a 90% chance that the fed funds rate will be cut again in November by 25 basis points.
Global and U.S. Inflation
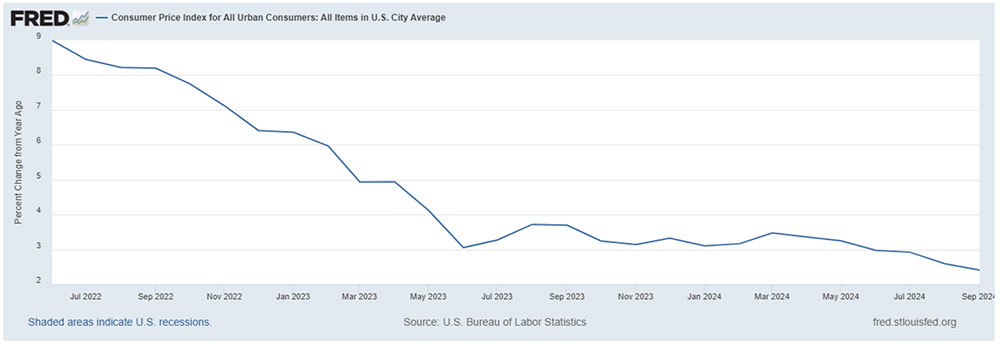
Global inflation, including inflation in the United States, has declined significantly since peaking in 2022. The decline played a major role in the Federal Reserve’s decision to cut interest rates in September. The graph below shows the annualized U.S. inflation rate since June 2022, as measured by the twelve-month change in the Consumer Price Index. Generally, inflation has consistently declined from its peak of 9.0% in June 2022 to 2.4% in September 2024. The September increase of 2.4% was the smallest 12-month increase since February 2021.
Percent Change in Consumer Price Index from One Year Ago
June 2022 – September 2024
The table below shows the annual inflation rate for Europe, the United Kingdom, Canada, Australia, Mexico and the United States from 2019 through August 2024. Although there are regional differences, note that the trends in inflation are similar across most countries. The trends are similar because global factors impacted global prices. Near record or record levels of inflation were recorded for the United States, the Euro Area, Canada, and the United Kingdom in 2022. Global inflation increased in 2021 as supply chain problems appeared and global oil prices began rising due to the economic recovery. Those factors peaked in 2022, with price spikes in global energy and food prices linked to Putin’s invasion of Ukraine and lingering supply chain issues which contributed significantly to inflation. The mitigation of global factors that contributed to inflation are reflected by the significant decline in inflation that has generally occurred around the world since 2022.
Another factor that contributed to price increases for U.S. consumers was record corporate profits (and profit margins). A measure of U.S. corporate profit margins tracked by the Federal Reserve was recently at levels not seen since the early1950s, indicating that the increased prices charged by businesses exceeded their increased costs for production and labor. After-tax profits as a share of gross value added for non-financial corporations, a measure of aggregate profit margins, exceeded 15% in both 2021 and 2022, the highest level since the early 1950s. In the fourth quarter of 2023, corporate profits were approximately double what they were in the fourth quarter of 2019.
Global Inflation Rates 2019 – August 2024
| 2020 | 2021 | 2022 | 2023 | 2024* | |
| Euro Area | 0.3 | 2.6 | 8.4 | 5.4 | 2.2 |
| Canada | 0.7 | 3.4 | 6.8 | 3.9 | 2.0 |
| U.K. | 0.9 | 2.6 | 9.1 | 7.3 | 2.2 |
| Australia | 0.8 | 2.9 | 6.6 | 5.6 | 3.8 |
| Mexico | 3.4 | 5.7 | 7.9 | 5.5 | 5.0 |
| U.S. | 1.2 | 4.7 | 8.0 | 4.1 | 2.5 |
*Inflation rate for 12 months ended August 2024; Australia is for 12 months ended June
Energy Production
Energy prices have been aided by the ramp up in U.S. and global oil production. According to the U.S. Energy Information Administration, the United States produced more crude oil than any nation at any time in 2023. Crude oil production in the U.S. averaged 12.9 million barrels per day in 2023, breaking the previous U.S. and global record of 12.3 million set in 2019. U.S. and global oil production decreased in 2020 due to an approximate 75% decline in oil prices which was caused by a significant drop in demand resulting from the global economic contraction. U.S. oil production declined by approximately 15% in 2020. U.S. and global oil production gradually increased beginning in 2021 as oil prices rose due to increasing demand as global economies recovered. In December 2023, average monthly U.S. crude oil production reached a record high of more than 13.3 million barrels per day.
Food Prices
Similar to overall inflation, food prices also increased significantly around the world. The table below shows five-year food inflation over the period March 2019 through February 2024 for the United States, Canada, the Euro Area, and the United Kingdom. The food price index increase was 27.2% for the United States, compared to 25.7% for Canada, 28.8% for the Euro Area, and 30.8% for the United Kingdom. Once again although there are regional and climate differences, global factors affected the general trends in food prices similarly between countries.
Five Year Food Inflation: March 2019 – February 2024
| Food Price Index March 2019 | Food Price Index Feb. 2024 | % Increase | |
| United States | 257.59 | 327.88 | 27.2 |
| Canada | 149.00 | 187.40 | 25.7 |
| Euro Area | 106.38 | 137.02 | 28.8 |
| United Kingdom | 103.10 | 134.90 | 30.8 |
The rate of food inflation, which includes food at home and food away from home, has declined significantly in the U.S. since peaking in August 2022. The chart below shows the annualized rate of food inflation from January 2023 to September 2024. In the past year, the annualized rate for food inflation declined from 3.7% in September 2023 to 2.3% in September 2024. For food at home, the annualized rate of inflation was 1.3% in September 2024.
U.S. Food Inflation (Annualized) January 2023 – September 2024

Housing and Shelter
In 2024 shelter (which includes housing and rent) has been a leading contributor to inflation. Shelter comprises approximately 36% of the Consumer Price Index, and shelter prices rose 4.9% for the 12 months ended September 2024.
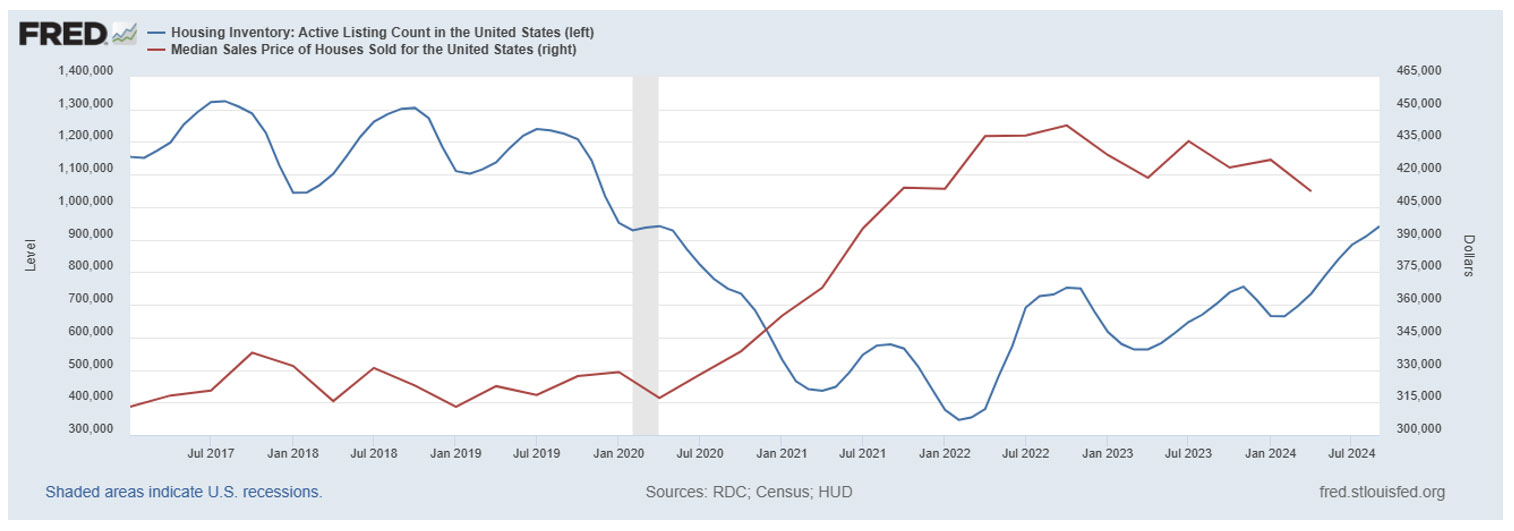
Housing prices began skyrocketing in the first quarter of 2020 as home listings (inventory) shrank to historically low levels. The quarterly median sales price of houses sold between the first quarter of 2020 through the fourth quarter of 2022 increased approximately 46%, nearly matching the 47% price increase that occurred over the entire last decade. The main driver causing housing prices to increase significantly was the lack of inventory, which declined significantly in 2020 and has generally remained relatively low.
The chart below shows the housing inventory (number of listings) and the median sales price for houses since January 2017. The housing inventory is indicated by the blue line (left axis); the median sales price of houses sold is indicated by the red line (right axis).
Housing Inventory, Number of Active Listings (blue line)
Median Sales Prices of Houses Sold (red line)
The Labor Market
Since 2021, the U.S. labor market has been strong based on a variety of measures, including job growth, total employment, and the unemployment rate. The last month job losses occurred was December 2020. The job growth that began in January 2021 led to record employment in September 2024.
Job Growth
The United States has had job growth every month since January 2021. The last month with job losses was December 2020. Since then, every month from January 2021 through September 2024 posted job gains. The prolonged period of job growth combined with the ramp-up of interest rates by the Federal Reserve led to an inevitable cooling of the labor market, with decreasing job growth beginning in the second quarter of 2024. Average monthly job gains were 147,333 in the second quarter compared to 267,333 in the first quarter. The cooling of the labor market, combined with the significant drop in inflation, contributed to the Federal Reserve cutting interest rates in September.
Although the labor market has cooled slightly, September job gains showed that the labor market remains solid. The preliminary estimate of 254,000 for September was the largest gain since March. The table below shows monthly and total annual job growth from January 2020 through September 2024.
One Month Net Change in Employment and Total Annual Change (in thousands)
January 2020 – September 2024

2020 was the worst year for jobs this century, with job losses of over 9.2 million for the year. 2021 and 2022 were the top two years for job growth this century, with 7.2 and 4.5 million jobs added, respectively.
The job growth in 2021 was at least partially due to the low total employment caused by the pandemic in 2020 and the return to a more normal economy in 2021. The nearly 7.3 million jobs added in 2021 reduced the unemployment rate from 6.4% in January to only 3.9% in December. The job growth in 2022 and 2023 was particularly impressive as significant job gains continued despite the growth that already occurred in 2021. The 7.5 million jobs added for the two years of 2022 and 2023 exceeded the 6.4 million jobs added over the three-years prior to COVID from 2017-2019. In 2024, job growth continued in every month through September, with approximately 1.8 million jobs added to the economy. Job growth has enjoyed an impressive run. As of September, job gains were recorded in 45 consecutive months.
The cooling of the labor market, which was critical to the Federal Reserve’s decision to cut interest rates, is demonstrated by the chart below which shows the number of unemployed persons per job opening since August 2009. In August 2024 the rate approached 1.0, meaning there was one job opening for every unemployed person. The rate had doubled since a low of 0.5 in the second quarter of 2022 when there were two job openings for every unemployed person. The chart reflects a softening in wage growth, which was also important for the Federal Reserve’s decision to cut interest rates in September. Since February 2023 real wages have increased with wage growth exceeding inflation. However, the 3-month moving average of median hourly wage growth was 4.6% in August 2024, down from a high of 6.4% in March 2023, another sign of a cooling labor market.
Number of Unemployed Persons per Job Opening (August 2009 – August 2024)

Total Employment
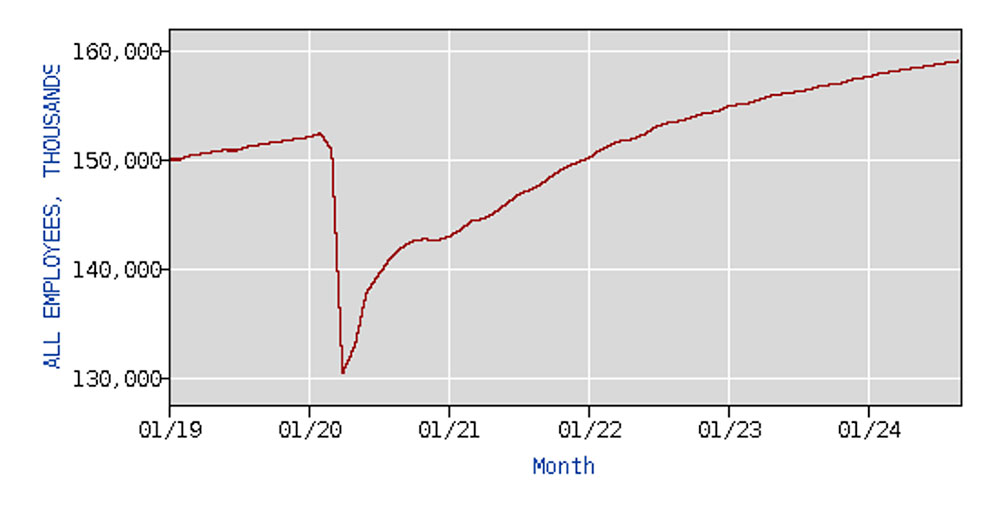
The consistent job growth that has occurred since January 2021 meant that more Americans were working in September 2024 than ever before. Since June 2022, each successive month has resulted in a record number of Americans working. In June 2022 total employment surpassed the February 2020 pre-pandemic historical high. The chart below shows total employment (in thousands) since January 2019. Approximately 159.1 million Americans were employed in September 2024, an increase of over 28 million workers since the April 2020 COVID low of 130.4 million. Nearly 7 million more Americans were working in September 2024 than the pre-pandemic high of 152.3 million in February 2020.
Total Employees (in thousands), January 2019 – September 2024
Unemployment Rate
Despite job gains occurring every month this year, the unemployment rate has increased slightly. This dichotomy is due to increased labor force participation. The unemployment rate is the percentage of unemployed people in the labor force that are willing and available to work and who have actively sought work within the past four weeks. When more people enter the workforce, it is possible for the unemployment rate to increase and still have increasing total employment. The unemployment rate was 4.1% in September, increasing slightly from January’s 3.7% and down from 4.3% in August.
The chart below shows the unemployment rate since the turn of the century. Recently, the unemployment rate hit a record high of 14.8% in April 2020, which surpassed the previous high of 10.8% in 1982. Despite the economic recovery beginning in May 2020, the economy stalled with 243,000 job losses in December 2020 and the unemployment rate perched at 6.7%. The economic recovery regained momentum in 2021, and the unemployment rate gradually declined from 6.4% in January to 3.9% by yearend. The trend continued in 2022 with unemployment dropping to 3.6% in December! The unemployment rate bottomed out at 3.4% in January 2023, the lowest rate since 1969. The unemployment rate began increasing slightly in late 2023, reflecting a cooling of the labor market and increased labor force participation. The unemployment rate of 4.1% in September 2024 was still relatively low compared to historical levels and total employment was at an all-time high.
Unemployment Rate January 2000 – September 2024

Economic Growth
Economic growth is measured by changes in Gross Domestic Product (GDP), which is the value of goods and services produced in a given time period. Economic growth that began in the second half of 2020 and continued through 2024 has propelled the U.S. economy to arguably the strongest in the world.
The economy struggled in 2020, with unemployment peaking at 14.8% in April and GDP declining 2.2%. The economy rebounded strongly in 2021 with U.S. GDP growth at 6.1%, the strongest economic growth since 1984. In 2022 U.S. economic growth slowed to 2.5%, as the focus of the Federal Reserve and central banks around the world shifted to increasing interest rates to fight inflation. Despite the rate increases, the U.S. economy grew at a surprisingly strong 2.9% annual rate in 2023, contributing to the what was arguably the strongest global economy. Between 2019 and 2023, the U.S. had stronger economic growth than any other G7 country, including Canada, Italy, Japan, France, the United Kingdom, Germany, and the Eurozone.
The table below shows how changes in the four components of Gross Domestic Product (GDP) contributed to the change in U.S. economic growth since 2017.
Contributions to Percent Change in Real Gross Domestic Product – Annualized Rate
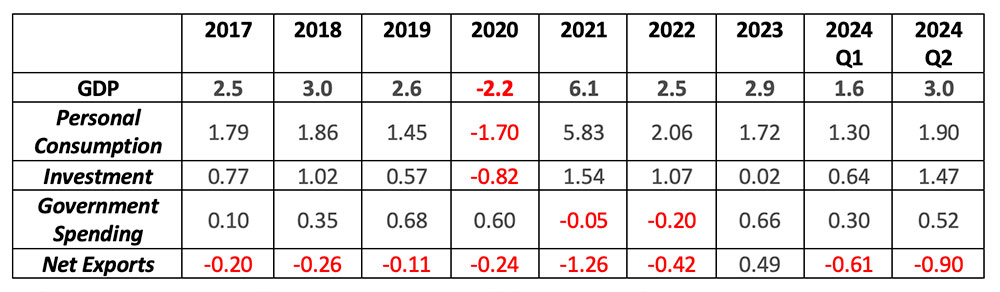
Personal consumption accounts for approximately two-thirds of GDP, and personal consumption has been the key and consistent driver of economic growth during the economic recovery, contributing positively to GDP growth since the third quarter of 2020. After cooling to 1.6% in the first quarter of 2024, economic growth was impressive at 3.0% in the second quarter. Importantly, both personal consumption and investment spending (including business investment in equipment and inventories) made significant contributions to economic growth. Despite increasing interest rates since early 2022, economic growth has remained solid. At its September meeting, the Federal Reserve forecasted annualized GDP growth of approximately 2% for 2024.
The Stock Market
In 2024, robust economic growth led to record stock market highs, overshadowing the uncertainties created by the U.S. presidential election and wars in the Middle East and Ukraine. The U.S. S&P 500 is a leading benchmark index for U.S. large company (large-cap) stocks, with a long-run historical annual average return of approximately 10%. Through the first week of October, both the year-to-date and 5-year average return of the S&P 500 significantly outperformed its historical average. According to Morningstar, the year-to-date return on the S&P 500 through October 4 was 20.5% while the 5-year average annual return was 14.3%.
U.S. stock market returns reflect the strong U.S. economic recovery since 2020.
For further information:
- Info from the Bureau of Labor Statistics:
- From the Federal Reserve:
- GDP Growth (and other national data) from the Bureau of Economic Analysis: GDP Growth
- From Eurostat: Euro Area Inflation
- From the Bank of Canada: Canadian Inflation
- Global Inflation, from rateinflation.com
- From Trading Economics: Food Inflation
- From the Atlanta Federal Reserve: Wage Growth Tracker
- Global Central Bank info:
- CME FedWatch Tool: CME Fed Funds Futures
- From the U.S. Energy Information Administration:
- From Investopedia: S&P 500 Average Return and Historical Performance
- From Morningstar: The S&P 500

Kevin Bahr is a professor emeritus of finance and chief analyst of the Center for Business and Economic Insight in the Sentry School of Business and Economics at the University of Wisconsin-Stevens Point.