Manufacturing employment is often viewed as a key benchmark for the U.S. labor market, as manufacturing jobs are generally higher paying and manufacturing of certain products is vital to the strategic interests of the United States.
In recent years manufacturing jobs have been in the spotlight for a variety of reasons. Tariffs were implemented in 2018 by the Trump administration with a partial objective of boosting U.S. manufacturing employment by returning jobs to the U.S. COVID provoked unprecedented supply chain disruptions and caused many companies to rethink supply chains and foreign sourcing. The Biden administration made several investments to increase manufacturing employment, including the CHIPS and Science Act of 2022 that promotes a return of semiconductor manufacturing jobs to the U.S. Manufacturing jobs and tariffs are also back in the spotlight with the current Trump administration, with a partial objective for tariffs to return manufacturing jobs to the U.S.
Through the years much has changed for manufacturing. This blog will look at recent and long-term trends in U.S. manufacturing employment.
Manufacturing Employment since 1939
The U.S. Bureau of Labor and Statistics defines manufacturing as “establishments engaged in the mechanical, physical, or chemical transformation of materials, substances, or components into new products.” This definition includes the production of not only heavy machinery, vehicles, and electrical components, but also items such as beverages, vegetable preserves, and stationary. It does not include companies engaged in the design and marketing of products.
The chart below shows the long-term trends in U.S. manufacturing employment since 1939. Manufacturing employment is indicated by the blue line (left-axis); manufacturing employment as a percentage of total employment is indicated by the red line (right axis).
U.S. Manufacturing Employment (in thousands) and
Manufacturing Employment as Percentage of Total Employment January 1939–December 2024
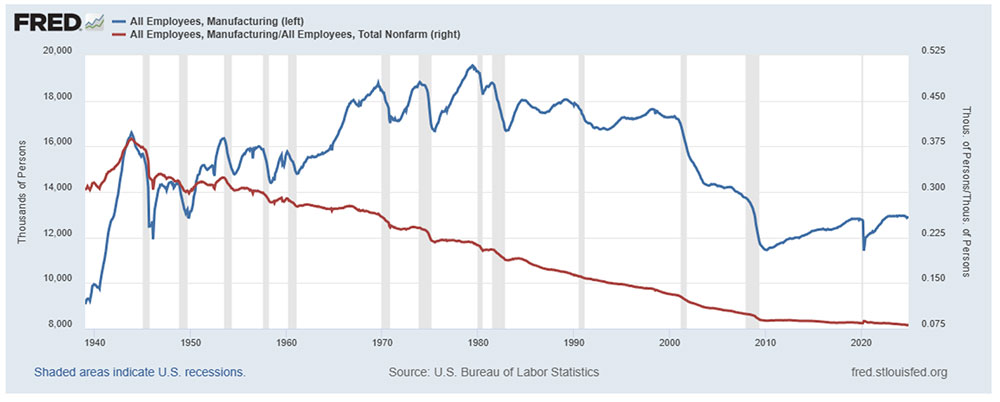
Blue Line – Manufacturing Employment (in thousands), left-axis
Red Line – Manufacturing Employment as a Percentage of Total Employment, right axis
Manufacturing employment has generally been on a downward trend in the United States since 1980. Prior to 1980, excluding the industrialized ramp-up that occurred due to Word War II, manufacturing employment experienced steady but cyclical growth. From 1939 through 1979 the number of people employed in the manufacturing sector generally increased, from 9.1 million in 1939 to a peak of 19.5 million in 1979. Things began to change for U.S. manufacturing in the 1980s, and a downward trend in manufacturing employment began in 1980. After starting the decade at 19.3 million, manufacturing employment ended the decade at 17.9 million, a decline of over 7%. The economic decline in the early 1990s contributed to a drop in manufacturing employment, but excellent economic growth later in the decade led to a rebound. The downward trend for manufacturing employment returned after the turn of the century with a sharp decline that generally continued through early 2010. Manufacturing employment declined from 17.3 million in January 2000 to a low of 11.5 million in December 2009, a drop of 33% over the decade. Compared to the peak of 19.5 million in 1979, manufacturing employment had declined approximately 41% by 2009.
After hitting a low of 11.5 million in early 2010, manufacturing employment steadily rose and generally mirrored economic growth, and was 12.8 million by the end of the decade. Manufacturing employment was relatively unchanged in 2019, despite tariffs and corporate tax breaks from the 2018 tax bill that encouraged investment in manufacturing employment. Even with the growth in manufacturing employment following the 2008 financial crisis, the manufacturing sector ended the decade with approximately 1 million fewer employees than what it had before the financial crisis. Manufacturing employment was 12.8 million in December 2019, an approximate 6.5% drop from the October 2007 level of 13.8 million. COVID took a toll on the economy in 2020, and manufacturing employment dropped over 10% from 12.8 million in January to a low of 11.4 million in April. Manufacturing employment began rebounding in May 2020 and rose back to 12.9 million by the end of 2024.
As a percent of total employment, manufacturing employment peaked during World War II in October 1943 at 38.9%. However, after peaking in 1943, the percentage of people employed in the manufacturing sector has generally been on a long and steady decline. By early 1980, manufacturing employment comprised slightly more than 21% of total employment. By the end of 2024, manufacturing employment was only about 8% of total employment.
Wisconsin Manufacturing Employment
Although manufacturing as a percent of total state employment has declined, Wisconsin continues to be a leading state for manufacturing. According to the National Association of Manufacturers, Wisconsin ranks second in the nation for manufacturing employment as a percent of total state employment. Indiana ranks first, but by the end of 2024 it was a virtual tie, with manufacturing employment as a percent of state employment at 15.83% and 15.78% for Indiana and Wisconsin, respectively.
The chart below shows manufacturing employment as a percent of total state employment for Wisconsin and Indiana relative to U.S. manufacturing employment as a percent of total employment over the period 1990-2024. Wisconsin is indicated by the blue line, Indiana the green line, and the U.S. the red line. Trends in manufacturing employment for Wisconsin and Indiana have generally mirrored the trend in U.S. manufacturing. Since January 1990, manufacturing employment as a percent of total state employment declined from 23.12% to 15.78% for Wisconsin and from 24.09% to 15.83% for Indiana. At the national level, manufacturing employment as a percent of total employment declined from 16.30% to 8.09%. Despite the decline, manufacturing employment as a percent of total employment for Indiana and Wisconsin was almost twice the percentage as the national rate at the end of 2024.
Wisconsin, U.S., and Indiana Manufacturing Employment as Percentage of Total Employment 1990–2024

Blue Line – Wisconsin Manufacturing Employment as a Percentage of Total State Employment
Green Line – Indiana Manufacturing Employment as a Percentage of Total State Employment
Red Line – U.S. Manufacturing Employment as a Percentage of Total Employment
Manufacturing Employment Changes by Industry
The table below shows the change in manufacturing employment for twelve different industries over a 40-year period, from 1979 to 2019. Only one industry, food manufacturing, saw an increase in employment. Food manufacturing employment had a 10% increase over the period from 1979 to 2019 rising to over 1.6 million. Food manufacturing rose to the third largest industry for manufacturing employment in 2019. Three industries saw declines of employment of over 1 million: 1) apparel and textile industries, 2) fabricated metal products and machinery, and 3) computer and electrical products.
The biggest drop in employment, by far, was incurred by the apparel and textile industries. In terms of both the absolute change in employment and the percentage decrease in employment, the apparel and textile industries had the greatest decline for any industry. Industry employment declined over 1.8 million to only 334,000, a drop of 85%, over the period 1979–2019.
Manufacturing Employment by Industry 1979–2019 (Seasonally Adjusted, in Thousands)

The largest industry in terms of manufacturing employment was fabricated metal products and machinery in both 1979 and 2019. However, employment declined to 2.6 million in 2019, a 38% drop from the 4.2 million in 1979. Computer and electrical products had been the second largest industry for manufacturing employment in 1979 with 2.8 million employees. In 2019, after declining 47% to employment of just under 1.5 million, the industry ranked fourth in manufacturing employment. Transportation equipment rose to the second largest industry for manufacturing employment in 2019; however, the employment of 1.7 million was still a decrease of 17% from 1979.
On a percentage basis, other industries experiencing significant drops in manufacturing included wood products and furniture (33%), nonmetallic mineral products (38%), paper and paper products (48%), and petroleum (45%). Other industries with more modest job declines included plastics and rubber (11%) and printing and publishing (4%).
Globalization, Manufacturing Employment, and Income
The globalization of international trade began to significantly increase in the decade of the 1980s. Globalization contributed to declining manufacturing employment as it provided greater access to low-cost sourcing options for U.S. businesses, primarily through low labor cost countries. Since the 1980s, global supply chain networks have evolved for many companies and industries. Companies can source inputs and products globally to minimize costs, maximize profits, and expand markets. The Conference Board estimated that in 1997 hourly compensation costs in manufacturing for Mexico were only 11% of what they were in the United States. In 2016, hourly compensation costs in manufacturing for Mexico were only 10% of what they were in the United States. Hourly compensation costs in manufacturing for China were estimated at less than 5% of U.S. costs until 2009 but were still only 11% of U.S. costs in 2013.
Low-cost sourcing options for companies contributed to low inflation for consumers from the early 1990s until the onset of COVID in 2020. Between 1992 and 2020, inflation never exceeded 4.0% and exceeded 3.0% in only six years. COVID, however, introduced never before seen supply chain interruptions and highlighted how these interruptions can negatively impact businesses, cause product shortages, and contribute to increased inflation for consumers. U.S. firms relying on foreign sourced inputs or products were particularly vulnerable to supply chain disruptions. Although cost had been a primary factor in considering foreign sourcing, COVID introduced a new factor to consider – product availability.
The graph below shows the real dollar value of U.S. imports of goods and services (blue line, left-axis) and real GDP per capita since 1947 (red line, right axis) expressed in billions of 2017 dollars. Using real rather than nominal dollar amounts will allow analyzing the changes in each after adjusting for inflation. Real GDP per capita measures output per person in a country with greater per capita output leading to greater income. As a result, real GDP per capita helps in assessing a country’s overall prosperity and standard of living. (Real GDP per capita is one variable to assess the standard of living because it measures income per capita. It is not an all-inclusive measure of the standard of living, as it does not consider factors such as income distribution, health care costs, access to healthcare, safety, environmental factors, etc.)
Real U.S. Imports and Real GDP Per Capita 1947-2024

Blue Line – Real Imports of Goods and Services (billions of chained 2017 dollars, left-axis)
Red Line – Real Gross Domestic Product per Capita (billions of chained 2017 dollars, right-axis)
The chart below breaks down the above graph in greater detail to show how real imports and real GDP per Capita increased since 1947. While globalization contributed to an increase in real imports and a reduction in manufacturing employment, it also contributed to an increase in real GDP per capita.
Real U.S. Imports and GDP per Capita

Over the 33-year period from 1947-1980, real imports increased $340.4 billion while real GDP per capita rose $17,129. The globalization of international trade began to significantly increase in the decade of the 1980s. Over the 20-year period from 1980 – 2000, real imports and GDP per capita increased $1,267.6 billion and $16,958, respectively. The rising trend accelerated for both real imports and GDP per capita since the turn of the century. Between 2000 and 2024, imports and GDP per capita increased $1,886.8 billion and $19,214, respectively. Although globalization may have contributed to a decrease in manufacturing employment, it was also a contributing factor to increasing real GDP, and consequently, income per capita.
Manufacturing Productivity
Globalization was not the only factor that contributed to the decline of manufacturing employment. In the 1980s new technology and automation significantly bolstered labor productivity in the manufacturing sector. Labor productivity is defined as output per labor hour. Increasing labor productivity is beneficial for reducing costs and prices; however, the increased output per labor hour can also reduce the demand for labor.
The chart below compares labor productivity in the manufacturing sector (blue line) relative to labor productivity in the business sector (red line) from 1987 through 2024. Growth in manufacturing labor productivity significantly outpaced the growth in business sector productivity from 1987 through 2011. Manufacturing labor productivity more than doubled over the period, increasing 129% while business sector productivity rose 71%. Since 2011 manufacturing labor productivity has declined slightly while business sector productivity has increased.
Labor Productivity: Manufacturing Sector vs. Business Sector, 1987–2024
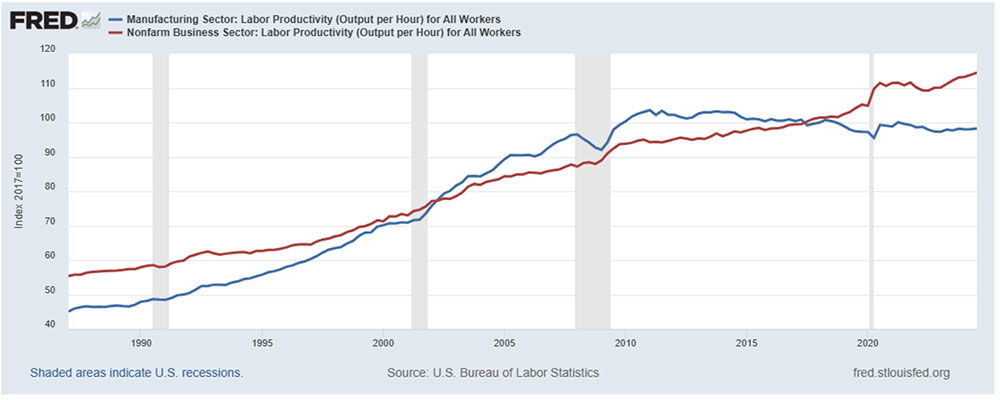
Blue Line – Manufacturing Sector Labor Productivity (2017 = 100)
Red Line – Business Sector Labor Productivity (2017 = 100)
Increasing technology and automation was affecting employment throughout the business sector, but had a more profound effect on manufacturing employment.
Globalization and The Service Sector
Globalization contributed to a shifting of employment in the U.S., from the manufacturing sector to the service sector. The graph below shows total employment (blue-line, left axis), service provider employment (red line, left-axis), manufacturing employment (green line, left-axis) and real imports of goods and services (purple line, right axis) from 1979 through 2024. Employment is shown in thousands, real imports are shown in billions of chained 2017 dollars.
Similar to real imports, total employment and service sector employment generally grew consistently over the entire period. When U.S. manufacturing employment peaked at 19.5 million in 1979, total employment was nearly 90 million and service sector employment was approximately 65 million. In December 2024, manufacturing employment declined to 12.9 million while total employment and service sector employment increased to 159.5 million and 137.7 million, respectively. Between 1979 and December 2024, manufacturing employment declined approximately 6.5 million, a drop of approximately 33%, while total employment increased 70.7 million, an increase of nearly 80%. Service sector employment rose by 73.6 million, an increase of approximately 115%. Low-cost foreign sourcing of products contributed to a changing economic landscape for the labor market, with a switching from manufacturing to service jobs. Between 1979 and 2024, manufacturing employment decreased significantly while service sector jobs, excluding economic downturns, consistently increased. In December 2024, the U.S. had record high total employment of 159.5 million.
Total Employment, Service Employment, Manufacturing Employment and Real Imports of Goods and Services (1979-2024)

Blue Line – All employees, total nonfarm (thousands, left-axis)
Red Line – All employees, service-providing (thousands, left-axis)
Green Line – All employees, manufacturing (thousands, left axis)
Purple Line – Real imports of goods and services (billions of chained 2017 dollars, seasonally adjusted annual rate); right axis
Summary and Conclusion
After peaking at 19.5 million in 1979, manufacturing employment declined approximately 41% over the next 30 years to a low of 11.5 million in December 2009. Two decades in particular featured dramatic declines in manufacturing employment, 1980–1989 (7% decline) and 2000–2009 (33% decline). Although manufacturing employment began a slight rebound in 2010 before being interrupted by COVID, manufacturing employment of 12.9 million at the end of 2024 was still 6% less than what it had been in December 2007 prior to the start of the financial crisis. As a percent of total employment, manufacturing employment has been on a long and steady decline after peaking during World War II in October 1943 at 38.9%. By early 1980, manufacturing employment comprised slightly more than 21% of total employment. By the end of 2024, manufacturing employment was only about 8% of total employment.
The drop in employment was widespread across manufacturing industries. Only food manufacturing saw an increase in employment between 1979 and 2019 while eleven other manufacturing industries experienced significant declines. The apparel and textile industry led the decline in manufacturing employment, with a drop of 85%.
The landscape has changed for manufacturing since the 1980s. Globalization and automation were key factors driving the reduction in manufacturing employment. The globalization of international trade began to significantly increase in the decade of the 1980s. Globalization contributed to declining manufacturing employment as it provided greater access to low-cost sourcing options for U.S. businesses, primarily through low labor cost countries. Since the 1980s, global supply chain networks have evolved for many companies and industries. Companies can source inputs and products globally to minimize costs, maximize profits, and expand markets. Also in the 1980s, increased technology and automation significantly bolstered labor productivity in the manufacturing sector. Increasing labor productivity is beneficial for reducing costs and prices; however, the increased output per labor hour can also reduce the demand for labor.
Can manufacturing jobs return to the U.S.? Maybe, but at a cost. And while it might be desirable to have some manufacturing jobs return to the U.S., it is not desirable for all jobs to return.
Under both the Trump and Biden administrations, corporate financial incentives played a major role in trying to return manufacturing jobs to the U.S. In 2018 and 2019, the implementation of tariffs and changes in corporate taxes provided incentives for companies to invest in manufacturing. Tariffs are basically a tax on the U.S. business importing the goods from a foreign country. Tariffs are paid by the business importing the goods, not the foreign country sending the goods to the United States. Tariffs were implemented in 2018 (and 2025) by the Trump administration with a partial objective of boosting U.S. manufacturing employment through returning jobs to the U.S. The statutory corporate tax was lowered from 35% to 21% and companies were allowed to expense, rather that depreciate, capital spending (spending on property, plant, and equipment). Despite the significant tariff and tax incentives, manufacturing employment increased by only an approximate 235,000 in 2018 and 2,000 in 2019. As a percentage of total employment, manufacturing declined from 8.5% to 8.4%. Despite an economic expansion, federal corporate tax revenues declined by over $90 billion in 2018 due to the corporate tax incentives.
The CHIPS and Science Act of 2022 was passed to bolster U.S. semiconductor manufacturing, which was viewed as strategically important for several industries. According to the Semiconductor Industry Association, the U.S. share of global semiconductor manufacturing capacity declined from 37% in 1990 to just 12% by 2022. The drop in U.S. global semiconductor manufacturing capacity exacerbated COVID related sourcing problems and contributed to a significant increase in auto prices. While the ultimate impact on manufacturing remains to be seen, the Act included $52 billion in chip manufacturing incentives and research investments and a 25% manufacturing investment tax credit.
While tariffs and corporate financial incentives may increase manufacturing employment to some degree, tariffs can increase prices to consumers and corporate tax incentives are basically a federal subsidy to firms, as federal corporate tax revenues are reduced. COVID provoked unprecedented supply chain disruptions and caused many companies to rethink supply chains and foreign sourcing. However, there was a reason why supply chains were set-up the way they were in the first place. Companies could source inputs and products globally to minimize costs, maximize profits, and expand markets. In many instances, foreign sourcing lowered costs for corporations and prices to U.S. consumers.
Even during the longest economic expansion in U.S. history that began June 2009 and ended February 2020, manufacturing employment only modestly increased and ended the period with approximately 1 million fewer employees than what it had before the 2008 financial crisis. Any significant increase in future manufacturing employment would likely require substantial financial incentives for corporations. Certainly, manufacturing of strategically important products is desirable for long-term U.S. economic growth. However, there is a balancing act between bolstering manufacturing employment through corporate financial incentives and increasing the financial burden of consumers and individual taxpayers. There is also the issue of identifying which products are strategically important.
In addition, the labor market is tight. The last month with unemployment losses was December 2020. Since January 2021, 48 consecutive months of job growth lowered the unemployment rate to eventually hover around 4% (or lower) since December 2021, while real wages have increased since February 2023. Increasing manufacturing employment has the potential of straining the labor market and further increasing real wages, and consequently raising prices.
While increasing manufacturing employment and returning some jobs back to the U.S. might be desirable, bringing all manufacturing jobs back to the U.S. or manufacturing all products used by consumers and businesses is not. A mix of manufacturing and foreign sourcing can provide lower costs to manufacturers and lower prices to consumers. Firms can benefit from economies of scale and lower costs by focusing on manufacturing certain products and components while others are outsourced. Research and development can also be more focused. In addition, resources, including labor, are limited. Manufacturing key, strategically important products is important for U.S. economic growth and minimizing the impact of any future supply chain disruptions. However, attempting to manufacture all products used by consumers and businesses would raise costs to businesses and lower the standard of living for consumers through increased prices.
Going forward, the objective is to develop an optimal mix of manufacturing with foreign sourcing that provides the U.S. with the production of strategically important products, minimizes supply chain disruptions, and lowers costs to businesses and prices for consumers. That’s the objective, but it will be quite a challenge to achieve it.
For further information:
- From the Bureau of Labor Statistics: 40 Years of Falling Manufacturing Employment
- From the CATO Institute: The Reality of American Deindustrialization
- From the U.S. Dept. of Commerce: Manufacturing Booms Thanks to Biden – Harris Administration
- From the Conference Board, info on international manufacturing costs: International Compensation on Hourly Compensation Costs in Manufacturing
- From the Bureau of Labor Statistics: The U.S. Productivity Slowdown
- From Our World in Data: Global Manufacturing Employment
- From Whitehouse.gov: Historical Tables on Federal Revenue and Expenditures
- From Ernst and Young: CHIPS and Science Act
- From the Semiconductor Industry Association: The State of the U.S. Semiconductor Industry
- From the National Association of Manufacturers: Manufacturing as a Percent of Employment by State

Kevin Bahr is a professor emeritus of finance and chief analyst of the Center for Business and Economic Insight in the Sentry School of Business and Economics at the University of Wisconsin-Stevens Point.