Oil production has been in the news lately with President Trump calling for a ramp up of U.S. oil production which would hopefully lead to lower energy and goods prices. This blog will take a look at long-term trends in and the interaction between U.S. oil and petroleum production, oil prices and gas prices.
U.S. Crude Oil Production
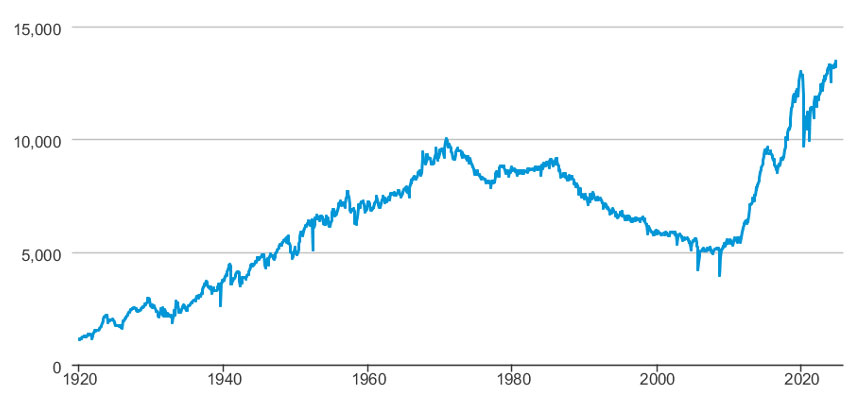
The graph below shows monthly U.S. crude oil production (thousands of barrels per day) since 1920 according to the U.S. Energy Information Administration. Between January1920 and November 1970, U.S. oil production gradually increased, from 1.097 million barrels per day to a peak of 10.044 million barrels per day before beginning a gradual decline in December 1970. After a brief ramp up in the early 1980s, U.S. oil production gradually and steadily declined from 1986 through 2008. Oil production bottomed out at 3.974 million barrels per day in September 2008, the lowest monthly production since April 1943. The longest economic expansion in U.S. history, however, occurred between June 2009 and February 2020. U.S. oil production more than doubled, growing from 5.4 million barrels per day in January 2010 to nearly 13 million barrels per day in December 2019. U.S. oil production grew as a result of greater efficiencies in production and new technologies, such as horizontal drilling and hydraulic fracturing, which were utilized in extracting petroleum and gas from shale deposits that were previously unprofitable. The prolonged period of economic expansion also increased demand for petroleum products.
U.S. Field Production of Crude Oil (thousands of barrels per day)
The table below focuses on U.S. monthly production of crude oil from January 2019 through November 2024. In early 2020, U.S. oil production decreased by approximately 25%, from 12.8 million barrels per day in January to only 9.7 million barrels per day in May. The market price of oil drastically dropped from approximately $60 per barrel in December 2019 to less than $20 per barrel in April 2020 as the demand for oil decreased due to the economic shock caused by COVID. When oil prices tank then oil profits decline, and there is much less incentive for oil production. In 2020, the oil industry had one of its worst years ever with many companies reporting losses for the year, including ExxonMobil and Shell.
As the economy began to recover in 2020, oil prices rose and generally so did oil production. Oil prices rose due to increased global energy demand and low inventory levels that resulted from production cuts in 2020. The December 2020 oil production was still nearly 14% below the level of production in December 2019. After declining in 2020, U.S. oil production has increased each year.
U.S. Field Production of Crude Oil (Thousand Barrels per Day)
January 2019 – November 2024
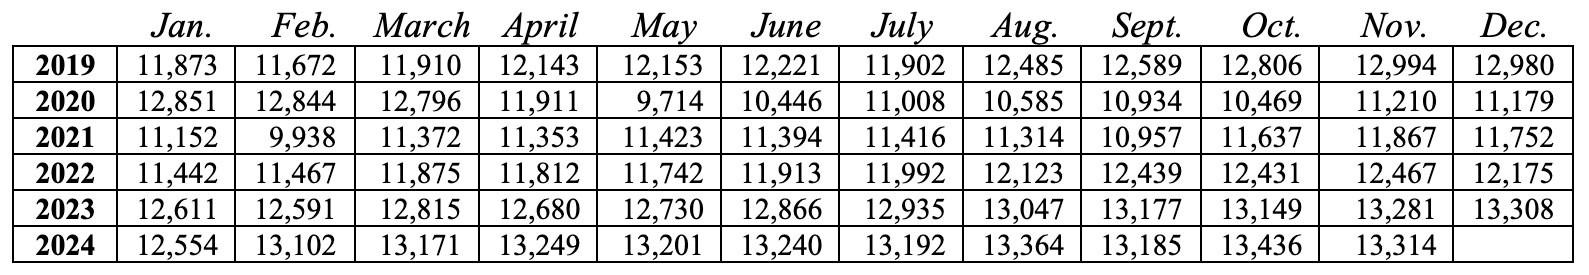
According to the U.S. Energy Information Administration, the United States produced more crude oil than any nation at any time in 2023. Crude oil production in the U.S. averaged 12.9 million barrels per day in 2023, breaking the previous U.S. and global record of 12.3 million set in 2019. In December 2023, average monthly U.S. crude oil production reached a record high of more than 13.3 million barrels per day. That was surpassed in 2024, which was another record year for U.S. oil production.
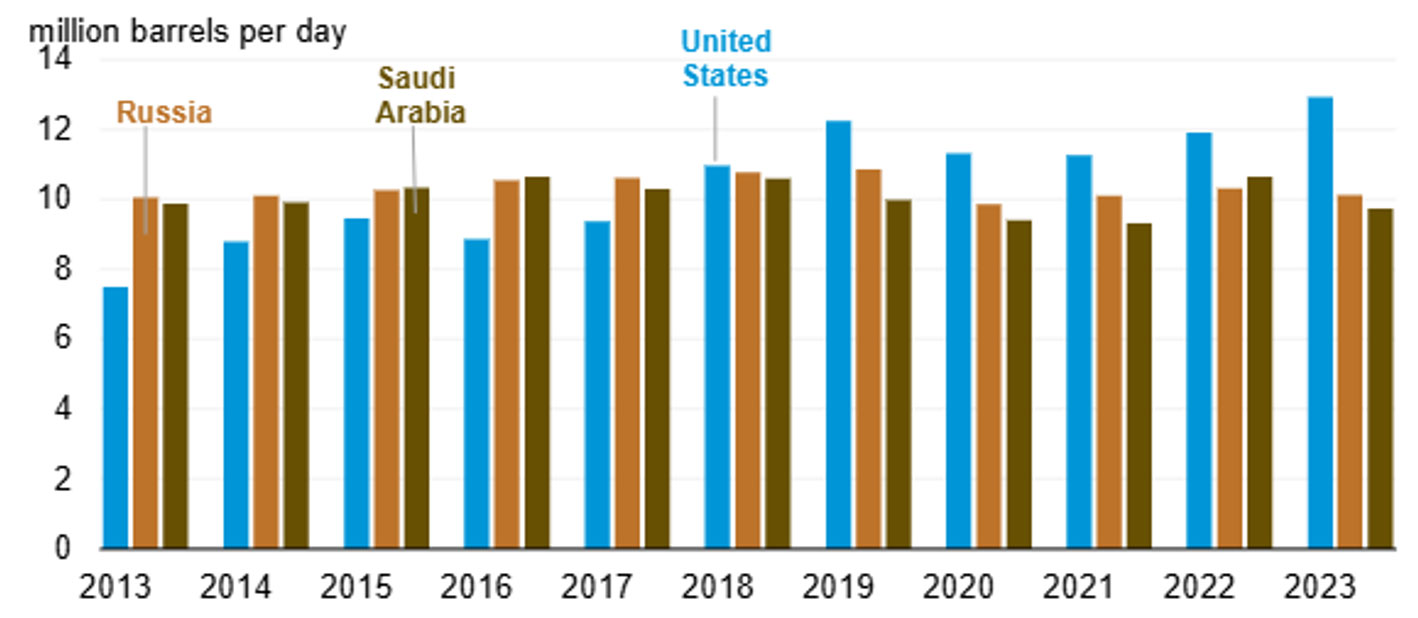
The chart below from the U.S. Energy Information Administration shows the oil production between 2013 and 2023 for the world’s top three producers, the United States, Saudi Arabia, and Russia. Combined, the top three producers accounted for approximately 40% of global oil production in 2023. Since 2018, the United States has led the world in oil production.
Average Annual Crude Oil and Condensate Production from World’s Top 3 Producers
2013-2023
U.S. Petroleum
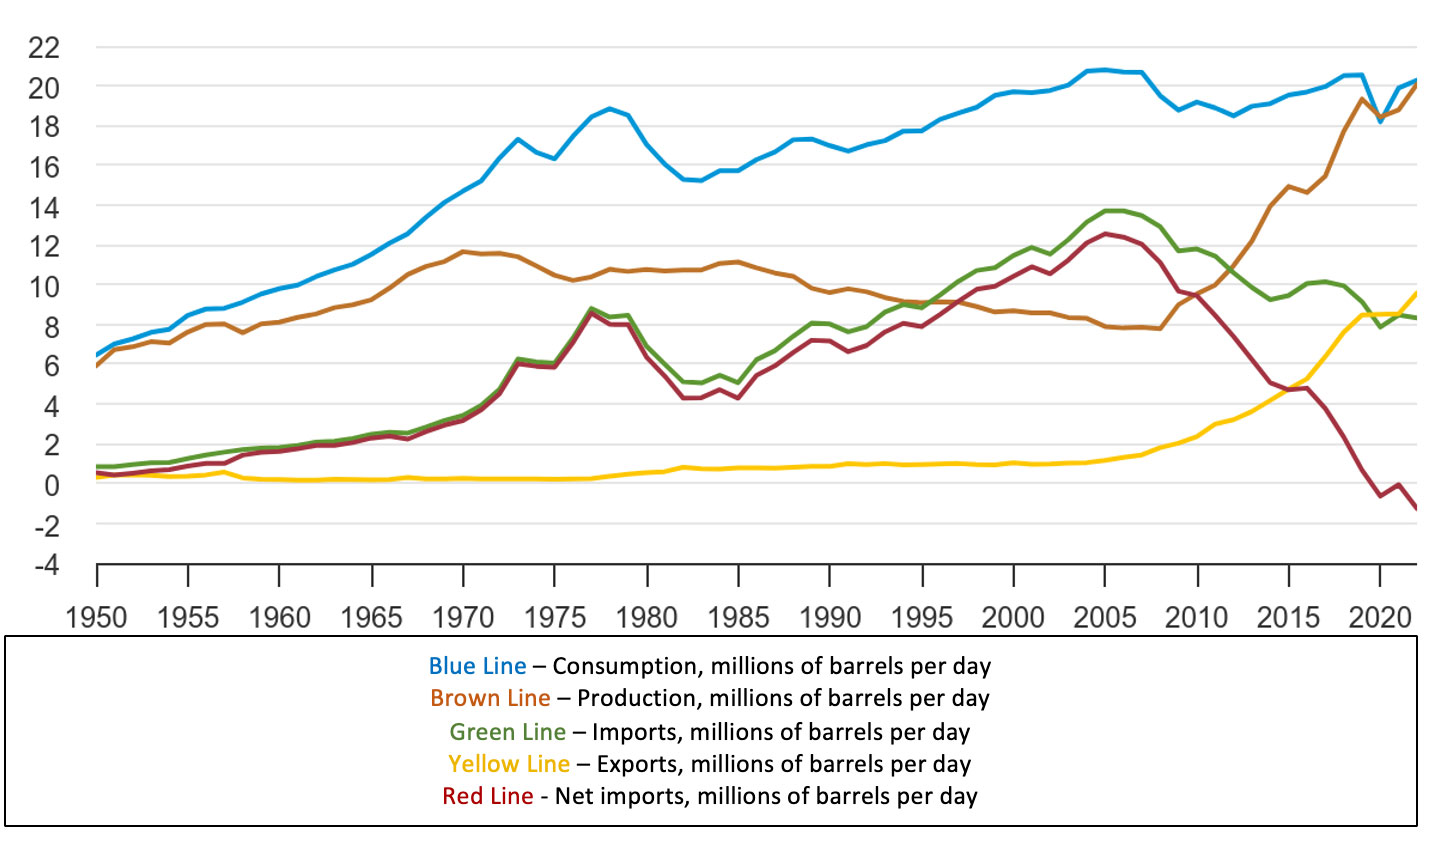
Crude oil and petroleum are related, but different. Petroleum is a broader, more inclusive term and refers to crude oil and petroleum products refined from crude oil, including gasoline, jet fuel, and propane. The graph below shows U.S. petroleum consumption (blue line), production (brown line), imports (green line), exports (yellow line), and net imports (red line) since 1950.
U.S. production of petroleum (including crude oil) has expanded greatly and significantly outpaced growth in consumption, particularly since the 2008 financial crisis. By 2020, U.S. consumption and production of petroleum was virtually equal. Between 2009 and 2022, production of petroleum increased from 8 million barrels per day to approximately 20 million barrels per day while consumption increased from 18 million barrels per day to 20 million barrels per day.
The United States became a total petroleum net exporter in 2020. Imports peaked in 2006 at 13.6 million barrels per day and declined to 8.3 million barrels per day by 2022. Exports of petroleum increased significantly from 1.37 million barrels per day in 2005 to over 9.6 million barrels per day in 2022.
U.S. Petroleum Consumption, Production, Imports, Exports and Net Imports
Oil production, and total energy production, have reached record levels in the United States this decade. According to the U.S. Energy Information Administration, when all sources of energy are considered, including petroleum, natural gas, renewable energy, coal and nuclear power, total annual energy production has exceeded total annual energy consumption since 2019. In addition, since 2019, the United States has been a net exporter of energy, with net exports in 2023 at their highest level ever.
U.S. Crude Oil Imports
U.S. consumption and production of petroleum is essentially equal. The U.S. is a net exporter of petroleum, and crude oil production has been at a record high. However, the U.S. exports and imports crude oil, and overall is a net importer of crude oil. Why? The answer includes market economics and differences in domestically produced oil relative to foreign oil.
Oil is a global commodity, but there are generally product differences between domestically produced oil and foreign produced oil. The U.S. imports and exports crude oil because different types of oil are needed to make various products cost effectively. U.S. produced crude oil is generally lighter viscosity than imported foreign produced oil, and some petroleum products may require the heavier foreign oil. The viscosity of oil (light or heavy) and sulfur content (low or high) determine the processes and costs needed to change the oil into a petroleum product. Refineries generally match their processing capabilities with types of crude oils from around the world that enable production of needed domestic products, and products that can be profitably exported. Despite the record U.S. crude oil production, the oil may not match what is needed to make all of the products that Americans use.
Oil is rarely used as a raw commodity for consumption; rather it must be refined into some type of petroleum product. Oil must be produced, refined, and then the manufactured product delivered to where there is consumer demand. Location becomes a key issue for the manufacture of petroleum products, including where the oil is produced, where the refining and manufacturing of products takes place, and where the final product must be shipped. The mix of oil prices, production costs, and transportation costs may make foreign oil cheaper to use in the manufacture of a petroleum product than domestically produced oil when all costs are considered.
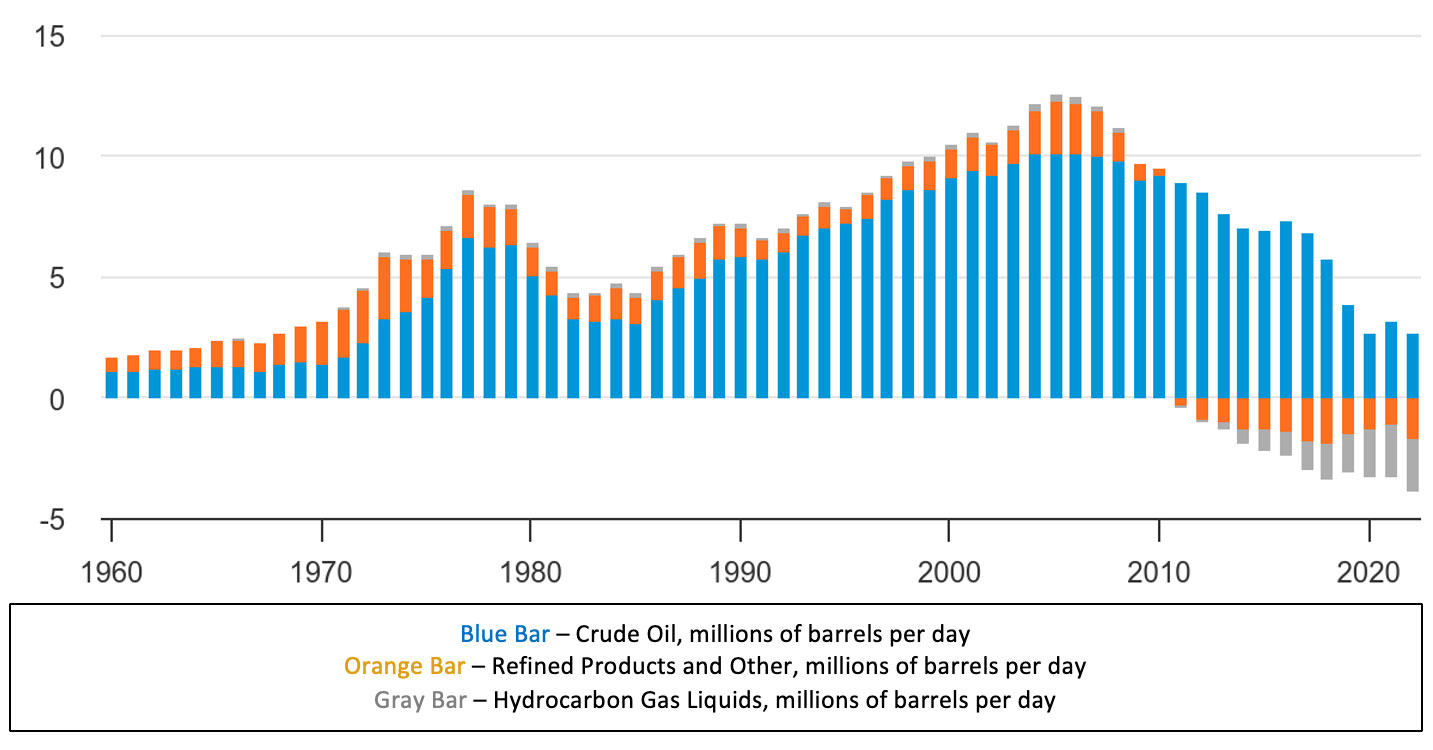
Although oil imports are needed to make desired products for U.S. consumers, the volume of oil imports has fallen significantly after peaking in 2006. The chart below shows U.S. net petroleum imports by type, including crude oil, hydrocarbon gas liquids, and refined products and other. Imports of crude oil steadily declined after topping out at 10.09 million barrels per day in 2006. Beginning in 2020, imports of crude oil hovered around 3 million barrels per day, a 70% decline from the 2006 peak.
U.S. Net Petroleum Imports by Type (millions of barrels per day)
The top five sources of U.S. crude oil imports by percentage share of U.S. total crude oil imports in 2022 were: Canada (60%), Mexico (10%), Saudi Arabia (7%), Iraq (4%) and Columbia (4%).
Global Oil Prices vs. U.S. Oil Prices
Two of the prominent benchmarks for oil prices are Brent Crude and West Texas Intermediate (WTI) crude. According to Investopedia.com, Brent Crude is the most widely used global benchmark for oil pricing, with approximately 80% of global crude contracts tied to the Brent Crude oil price. Brent Crude is the main benchmark for European oil prices, as the crude is derived from five different oil fields in the North Sea. WTI crude is the primary benchmark for United States oil prices and refers to oil extracted from U.S. wells and sent via pipeline to Cushing, Oklahoma. Both Brent Crude and WTI crude are viewed as ideal for the refining of gas and diesel fuel.
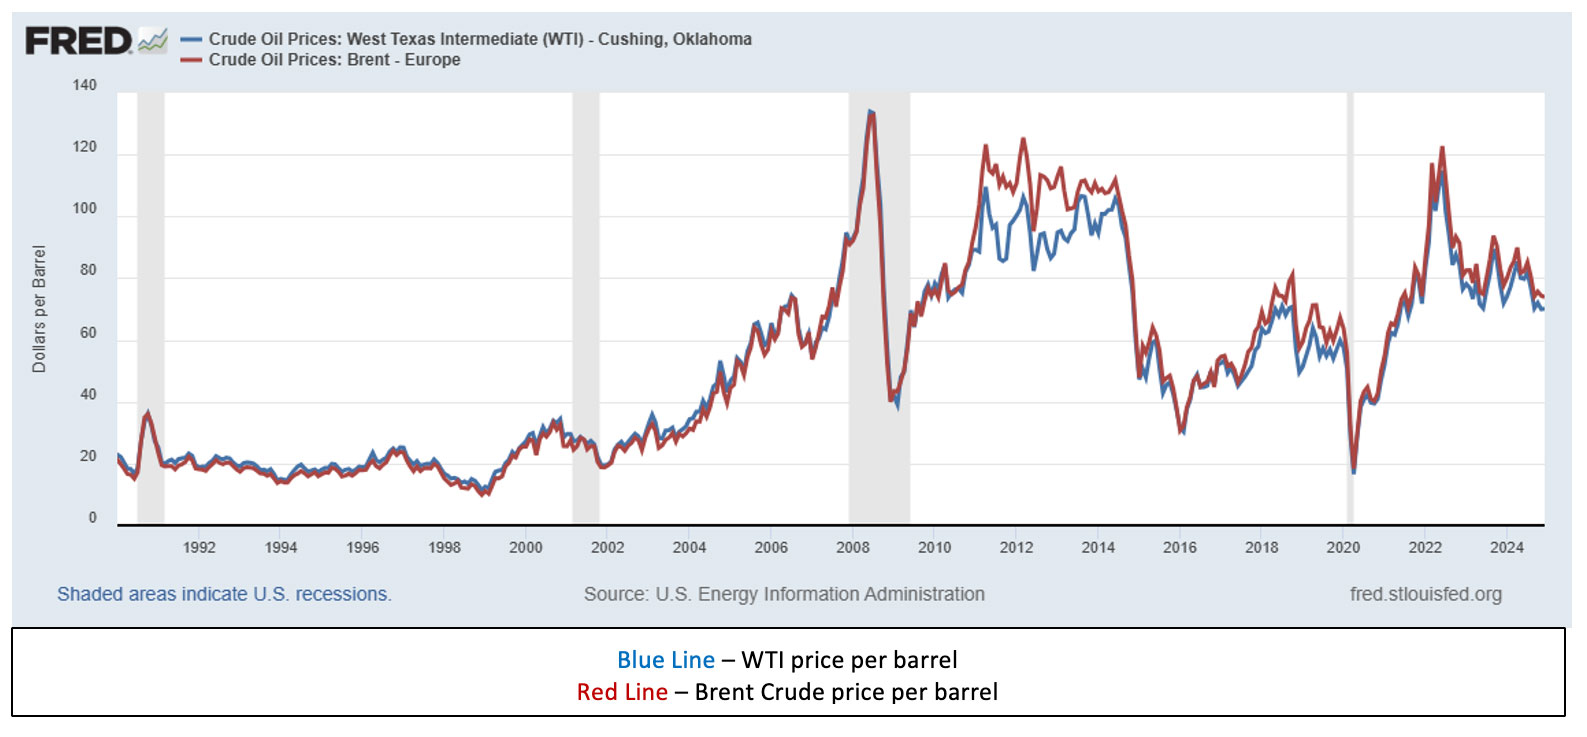
The graph below shows the average monthly price of WTI crude relative to the average monthly price of Brent Crude over the period January 1990 through December 2024. Although differences exist between oil markets, the overall ups and downs of U.S. and European oil prices are strongly related, indicating a truly global energy market. Factors affecting the price of Brent Crude affect the price of WTI, and vice versa.
West Texas Intermediate Crude Oil Prices (U.S., blue) vs. Brent Crude Oil Prices (Europe, red)
January 1990–December 2024
Oil prices since 2020 have been greatly affected by global economic performance and the war in Ukraine. The severe, global economic contraction in early 2020 caused by COVID drastically reduced the demand for energy, and the price of Brent Crude sank from $63 per barrel in January to $18 per barrel in April, while WTI slid from $58 per barrel to less than $17 per barrel. Oil prices began rebounding with the global economy in the second half of 2020 and continued to rise in 2021, as growing global energy demand and low inventory levels that resulted from production cuts fueled the price increase. Oil prices rose gradually in 2021 with Brent Crude peaking at over $83 per barrel in October and declining to $75 per barrel by December.
In 2022 energy prices were a key contributing factor to global inflation, as oil prices skyrocketed with Putin’s invasion of Ukraine. Brent Crude rose from $75 at yearend 2021 to over $122 in June before dropping to around $80 in December. The price decline was due to increasing economic uncertainty as global interest rates rose to combat inflation. Recent Middle East tensions caused some price volatility in the past few years, but Brent Crude closed 2024 at approximately $74 per barrel with WTI at $70 per barrel.
Changing Oil Prices and Changing Gas Prices
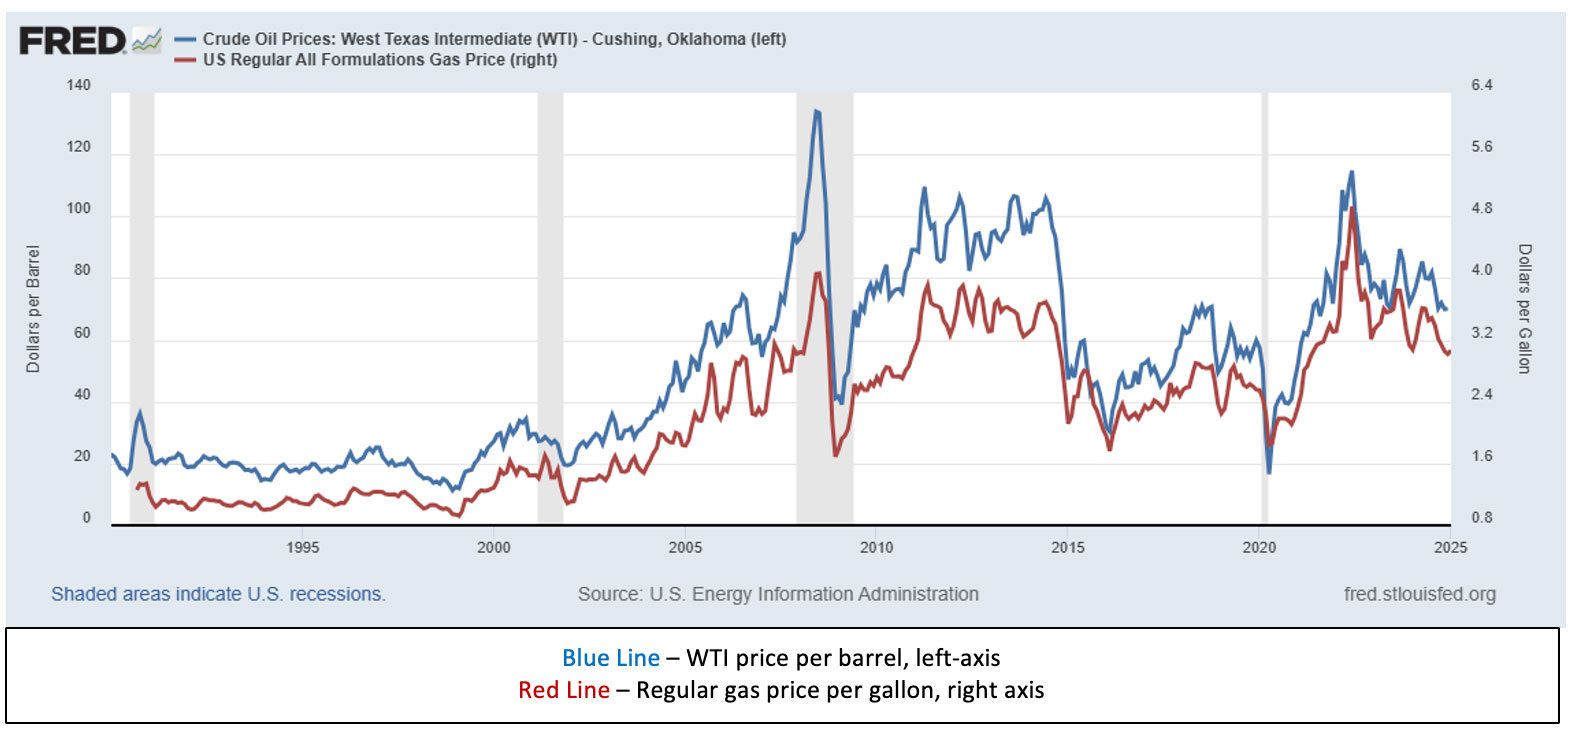
The graph below shows the average monthly price of WTI crude oil (blue line, left axis) relative to the average monthly price per gallon of regular gas (red line, right axis) from January 1990 through December 2024. Although differences exist in the factors that affect each market, the overall trend in changes in gas prices strongly reflects the overall trend in changes in oil prices.
In the current decade, the price of WTI crude and the per gallon price of gas hit their lowest point in the same month, and the price of WTI crude and the per gallon price of gas also peaked in the same month. The 2020 economic decline caused the price of WTI crude and gas to hit their lowest prices of the decade thus far. WTI crude fell from $59.82 in December 2019 to $16.55 in April 2020, its lowest price since March 1999. The price of gas declined from $2.55 per gallon in December 2019 to $1.84 per gallon in April 2020. The economic recovery, combined with the war in Ukraine, drove oil prices from their low of $16.55 in April 2020 to a peak of $114.84 in June 2022, an increase of nearly 600%. The increase in the price of oil contributed to inflation and higher gas prices, which rose from their low of $1.84 per gallon in April 2020 to a peak of $4.93 per gallon in June 2022.
Although U.S. oil production has been strong, U.S. gas prices are primarily driven by the global price of oil. When the global price of oil increases, U.S. gas prices generally increase. When the global price of oil decreases, U.S. gas prices decrease. The global price of oil is influenced by many factors, including U.S. and global production levels, supply chain disruptions (i.e. wars), global economic growth, and geopolitical uncertainties (i.e. Middle East military conflicts). Whatever affects the global price of oil will likely affect prices paid by Americans at the pump.
West Texas Intermediate Crude Oil Prices (U.S.) vs. U.S. Regular Gas Prices, Monthly
January 1990–December 2024
Summary
According to the U.S. Energy Information Administration, petroleum accounts for approximately 38% of energy consumption in the United States. Crude oil, both domestically produced and imported, is needed for the manufacture of petroleum products.
In 2023 the United States produced more crude oil than any nation at any time. In December 2023, average monthly U.S. crude oil production reached a record high of more than 13.3 million barrels per day. That was surpassed in 2024, which was another record year for U.S. oil production. Since 2018, the United States has led the world in oil production.
U.S. production of petroleum (including crude oil) has expanded greatly and significantly outpaced growth in consumption, particularly since the 2008 financial crisis. By 2020, U.S. consumption and production of petroleum was virtually equal. Oil production, and total energy production, have reached record levels in the United States this decade. According to the U.S. Energy Information Administration, when all sources of energy are considered, including petroleum, natural gas, renewable energy, coal and nuclear power, total annual energy production has exceeded total annual energy consumption since 2019. In addition, since 2019, the United States has been a net exporter of energy, with net exports in 2023 at their highest level ever.
Although crude oil production has been at a record high, the U.S. is a net importer of crude oil. Differences in viscosity and sulfur content between domestically produced and foreign oil make imported oil more desirable for some needed consumer products. In addition, differences in production and transportation costs may make imported oil more attractive for the manufacture of some petroleum products. Although oil imports are needed to make desired products for U.S. consumers, the volume of oil imports has fallen significantly and consistently after peaking in 2006.
Crude oil prices are closely tied to gas prices. When the global price of oil increases, U.S. gas prices generally increase. When the global price of oil decreases, U.S. gas prices decrease. The global price of oil is influenced by many factors, including U.S. and global production levels, supply chain disruptions (including wars), global economic growth, and geopolitical uncertainties (including Middle East military conflicts). Whatever affects the global price of oil will likely affect prices paid by Americans at the pump.
The ultimate impact of ramping up U.S. oil output to even greater levels on the economy, including the effect on prices and costs incurred, is yet-to-be-determined. It’s a balancing act for oil companies, as oil prices are affected by supply, demand and other global factors. The major focus of oil companies is to maximize profits and returns for shareholders. Increasing output may increase revenues and profits. However, increasing the supply of oil can also lower global oil prices and increase production costs, and consequently lower profits. The effect on profits and returns to shareholders will be primary considerations when oil companies consider changing production levels.
For further information:
- From the U.S. Energy Information Administration:
- Federal Reserve Economic Data (FRED) for West Texas Intermediate oil prices: West Texas Intermediate Oil Prices
- From the U.S. Energy Information Administration: Gas Prices
- From Investopedia.com: Oil Benchmarks
- Info on global gas prices from GlobalPetrolPrices.com: https://www.globalpetrolprices.com/gasoline_prices/
- From the American Petroleum Institute: Why the U.S. Must Export and Import Oil
- From the Council on Foreign Relations: How the U.S. Oil and Gas Industry Works
- From NASDAQ: America Produces Enough Oil to Meet Its Needs, So Why Do We Import Crude?
- From the U.S. Bureau of Labor Statistics: The Reemergence of the U.S. as a Global Petroleum Producer

Kevin Bahr is a professor emeritus of finance and chief analyst of the Center for Business and Economic Insight in the Sentry School of Business and Economics at the University of Wisconsin-Stevens Point.