
The United States entered 2025 with the largest and strongest economy in the world. In 2024, moderate economic growth continued, with more Americans working than ever before. Job gains were recorded in every month with December the 48th consecutive month of job growth. The labor market was balanced with unemployment hovering around 4.0% and real wages increasing. The U.S. stock market hit several record highs and was a global leader in providing returns to shareholders while interest rates finally fell. Certainly, all was not perfect and challenges remained. Inflation, although down significantly from its peak in 2022, remained above desired levels. The housing market continued to be a challenge for home buyers, with low inventory driving up home prices and relatively high financing costs making home ownership unaffordable for many. However, solid economic growth was poised to continue in 2025 absent an economic shock.
Unfortunately, there was an economic shock – tariffs. In 2025, tariffs have arguably been the greatest single factor impacting the economy. U.S. implemented tariffs have impacted international relations and trade, business decisions, consumer buying behavior, the bond market, and tanked the stock market. It has increased the challenges for Federal Reserve policy, with the ultimate impact on inflation yet-to-be determined. Inflation remained at higher than desired levels in early 2025, with newly implemented tariffs bracing Americans for the potential of stagflation.
This report begins with an overview of tariffs, trade, and manufacturing, followed by an economic update which includes economic growth, inflation, the labor market, interest rates, and financial market performance.
Tariffs, Trade and Manufacturing
Tariffs and Trade
A tariff is basically a tax paid by a business to the U.S. government for importing goods from a foreign country. Tariffs are paid by the business importing the goods, not the foreign country sending the goods to the United States. Tariffs are a regressive tax, hitting lower and middle-income Americans to a greater degree than wealthier Americans, as lower and middle-income Americans spend a greater share on goods and buy relatively lower cost, imported goods to a greater degree. Tariffs represent an increase in the government regulation of international trade and impact financial markets. In 2024, U.S. imports and exports totaled approximately $3.3 trillion and $2.1 trillion, respectively. With the U.S. population at approximately 340 million, import product demand was nearly $10,000 per U.S. resident in 2024. In fiscal year 2023, tariffs raised approximately $80 billion, only about 2 percent of the $4.44 trillion in total Federal tax revenue. Individual income taxes, corporate taxes, and payroll taxes provided 49, 36, and 10 percent of total Federal tax revenue, respectively.
Thus far, 2025 has been the year of the tariff. The parade of U.S. implemented tariffs began in February when President Trump signed an executive order targeting Canada, Mexico, and China. Beginning in March, a 25% tariff tax was implemented on American businesses importing goods from Canada and Mexico. Tariffs were already in place on imports from China, but a new 10% tariff was implemented in February which doubled to 20% in March. Canada, Mexico, and China immediately responded with retaliatory tariffs on goods imported from the United States.
On April 2, the Trump Administration announced a minimum 10% global tariff rate, with country specific tariff rates ranging from 10% to approximately 50%. Although the Trump Administration referred to the new tariffs as “reciprocal”, the rates were not based on the tariff rates charged on U.S. imports by a given country. Rather, the “reciprocal” tariff rates were based on a mathematical formula: (trade balance/imports)/2. For example, the trade deficit with China in 2024 was $295.4 billion while imports were $438.9 billion. Dividing $295.4 billion by $438.9 billion equals 67%; dividing 67% by 2 and rounding equals 34%, the “reciprocal” tariff rate for China. The “reciprocal” tariff rate for Vietnam became 46%. The tariff formula used by the Trump Administration focused on trade deficits and did not take into account international trade in services, investments, or the size of a country’s economy.
The table below shows total trade, economy size (as measured by gross domestic product (GDP)), and the “reciprocal” tariff rate for the top ten U.S. trading partners. The size of the U.S. economy is an important contributing factor to the U.S. trade deficit with many countries. Simply put, the U.S. can afford to buy a lot more stuff from other countries than they can from the U.S. The size of the U.S. economy dwarfs the economies of many trading partners, being nearly 13 times the size of Canada’s economy and 65 times as large as Vietnam’s economy.
2024 Top Ten U.S. Trading Partners in Goods

*tariff rates for Mexico and Canada were established in March
The 2025 tariffs implemented by the Trump administration caused many countries to implement their own reciprocal tariffs, with the new tariff rates a function of the rate that the U.S. had placed on imports from their country. On April 9, the Trump administration announced a 90-day pause from the “reciprocal” tariffs announced on April 2, although the global tariff rate of 10% remained in effect. Tariffs remained on goods imported from China, with the tariff rate increasing to over 100% (with certain product exceptions). The 25% tariff rate (with certain product exceptions) was paused for Canada and Mexico on products covered by the USMCA. The 2025 tariffs may have long-term implications for international trade and relations, with countries considering new product sourcing and trading partner options.
The table below shows the weighted mean applied tariff rate for the United States and selected trading partners. The weighted mean applied tariff is the average of effectively applied rates weighted by the product import shares corresponding to each partner country. Generally, global tariff rates have been relatively low over the last decade. A brief spike in the U.S. rate occurred in 2019 due to Trump Administration initiated tariffs, but trade wars rescinded in 2020 and tariff rates declined. The U.S. mean tariff rate had spiked to 13.8% in 2019 but declined to 1.5% in 2020. Following the minimum global 10% tariff rate and “reciprocal” rates announced in April 2025, the U.S. mean tariff rate was estimated at approximately 22% according to Fitch Ratings, the highest U.S. mean tariff rate in over 100 years.
Weighted Mean Applied Tariff (percent)

Canada and Mexico
Prior to 2025, the United States, Mexico, and Canada Trade Agreement (USMCA) governed trade between the three countries since 2020, when it was implemented by the Trump Administration. The USMCA modified the North American Free Trade Agreement (NAFTA), the original trade agreement between the three nations implemented in 1994. Trade deals have a primary objective of reducing trade costs by lowering or eliminating tariffs and trade restrictions, making foreign markets more accessible for domestic industries. That changed in 2025, as the United States slapped new tariffs on goods imported from its big three trading partners – Canada, Mexico, and China. The U.S. and China had also reached a new trade agreement in 2020 implemented by the Trump Administration. Collectively, Mexico, Canada, and China comprise over 40% of total U.S. trade.
In 2018 and 2019, the Trump administration initiated a wave of tariffs between the U.S. and several countries, with a focus on imports from China. Although tariffs broadly declined in 2020, tariffs on China generally remained and were kept in place by the Biden administration. The tariffs, combined with increasing political tensions with China, have had a major impact on sourcing by U.S. firms since 2017. Table 1 below shows the 2024 U.S. top trading partners in goods (excluding services), while Table 2 shows the 2017 top trading partners in goods.
Table 1: 2024 U.S. Top Trading Partners in Total Trading of Goods
(billions of dollars)

Table 2: 2017 U.S. Top Trading Partners in Total Trading of Goods
(billions of dollars)

In both 2017 and 2024, the top three trading partners in goods with the U.S. were Mexico, Canada, and China. However, the ranking of trading partners changed, with Mexico rising from third to first and China falling from first to third. In 2024, the top trading partner in goods for the U.S. was Mexico, comprising 15.8% of total trade with $839.9 billion. Total trade with Mexico increased 50.8% from 2017, with exports increasing 37.4% to $334.0 billion and imports rising 61.1% to $505.9 billion. Canada was second with total trade of $762.1 billion in 2024, an increase of 30.9% from 2017. Exports rose 23.7% to $349.4 billion while imports increased 37.6% to $412.7 billion. Total trade with China decreased 8.4% from 2017 to $582.5 billion in 2024. The decline in trade was caused by a drop of 13.2% in imports from China since 2017 to $438.9 billion in 2024, while exports increased 10.0% to $143.5 billion.
The table below shows the top three trading partners for Wisconsin in 2024. Mirroring trends in U.S. international trade, exports and imports have become increasingly important for Wisconsin. In 2024, Wisconsin had exports of $27.5 billion, an increase of over 23% from $22.3 billion in 2017. Wisconsin imports were $38.9 billion in 2024, rising approximately 40% from $27.7 billion in 2017. Canada is Wisconsin’s top trading partner, and Wisconsin is a net exporter to Canada. Collectively, Canada, Mexico, and China accounted for nearly 49% of total trade, 48% of imports, and 50% of exports.
Wisconsin Top Trading Partners 2024
(all merchandise, millions of dollars)

Manufacturing
The globalization of international trade generally began ramping up significantly in the 1980s. Increases in both exports and imports consistently occurred; exceptions, however, did occur during global economic downturns. Increasing globalization generally led to a shift in manufacturing, from relatively high labor cost countries to relatively low labor cost countries. Tariffs have been implemented with at least a partial objective of boosting U.S. manufacturing employment by returning jobs to the U.S.
The chart below shows the long-term trends in U.S. manufacturing employment since 1939. Manufacturing employment is indicated by the blue line (left-axis); manufacturing employment as a percentage of total employment is indicated by the red line (right axis).
U.S. Manufacturing Employment (in thousands) and Manufacturing Employment as Percentage of Total Employment January 1939 – December 2024

(Source: Federal Reserve FRED Database; Bureau of Labor Statistics)
Manufacturing employment was generally on a downward trend between 1980 and 2009, with a precipitous decline between 2000 and 2009. Compared to the peak of 19.5 million in 1979, manufacturing employment had declined approximately 41% by 2009. Manufacturing employment declined from 17.3 million in January 2000 to a low of 11.5 million in December 2009, a drop of 33% over the decade. Manufacturing employment steadily (but only slightly) rose with the economic expansion of the last decade, ending 2019 at 12.8 million. Manufacturing employment was relatively unchanged in 2019, despite tariffs and corporate tax breaks from the 2018 tax bill that encouraged investment in manufacturing employment. Even with the growth in manufacturing employment following the 2008 financial crisis, the manufacturing sector ended the decade with approximately 1 million fewer employees than before the financial crisis. The economic decline in early 2020 dropped manufacturing employment over 10% from 12.8 million in January to a low of 11.4 million in April, but manufacturing employment began rebounding in May 2020 and rose back to 12.9 million by the end of 2024.
As a percent of total employment, manufacturing employment peaked during World War II in October 1943 at 38.9%. After peaking in 1943, the percentage of people employed in the manufacturing sector has generally been on a long and steady decline. By early 1980, manufacturing employment comprised slightly more than 21% of total employment. By the end of 2024, manufacturing employment accounted for about 8% of total employment. Although manufacturing as a percent of total state employment has declined, Wisconsin continues to be a leading state for manufacturing. According to the National Association of Manufacturers, Wisconsin and Indiana were virtually tied at end of 2024, with manufacturing employment as a percent of state employment at 15.8%.
The loss in manufacturing jobs is not just a U.S. phenomenon. The chart below shows manufacturing employment as a percent of total employment since the turn of the century for seven developed economies: 1) Germany, 2) Italy, 3) Mexico, 4) Japan, 5) United States, 6) United Kingdom, and 7) Canada. In each case, manufacturing employment as a percent of total employment declined. Automation and globalization have changed the manufacturing environment, with service sector jobs becoming increasingly important.
Manufacturing Employment as a Percent of Total Employment

The switch from manufacturing to a more service sector economy was not associated with a decline in income. Although the switch certainly affected workers within specific industries, the switch to a more service sector economy was associated with an increase in real GDP per capita. Real GDP per capita measures output per person in a country with greater per capita output leading to greater income. Real GDP per capita is one measure in assessing a country’s overall prosperity and standard of living. The per capita measure does not take into account changes in the distribution of income across a population and therefore is unaffected by changes in income inequality.
The chart below shows how real imports and real GDP per capita increased since 1947. Although manufacturing jobs declined, relatively high paying service sector jobs such as engineering, information technology, marketing, and finance have increased.
Real U.S. Imports and GDP per Capita
(Imports are Billions of Chained 2017 Dollars; First Quarter Annualized rate)

Over the 33-year period from 1947–1980, real imports increased $340.4 billion while real GDP per capita rose $17,129. The globalization of international trade began to significantly increase in the decade of the 1980s. Over the 20-year period from 1980 – 2000, real imports and GDP per capita increased $1,267.6 billion and $16,958, respectively. The rising trend accelerated for both real imports and GDP per capita since the turn of the century. Between 2000 and 2024, imports and GDP per capita increased $1,886.8 billion and $19,214, respectively. Although globalization may have contributed to a decrease in manufacturing employment, it was also a contributing factor to increasing real GDP, and consequently, income per capita.
The landscape has changed for manufacturing since the 1980s due to a variety of factors. Globalization and automation were key factors driving the reduction in manufacturing employment with increased technology and automation significantly bolstering labor productivity in the manufacturing sector. While increasing labor productivity reduces costs and prices, the increased output per labor hour can also reduce manufacturing employment. The globalization of international trade began to significantly increase in the decade of the 1980s, contributing to declining manufacturing employment as it provided greater access to low-cost sourcing options for U.S. businesses, primarily through low labor cost countries. Since the 1980s, global supply chain networks have evolved for many companies and industries. Companies can source inputs and products globally to minimize costs, maximize profits, and expand markets.
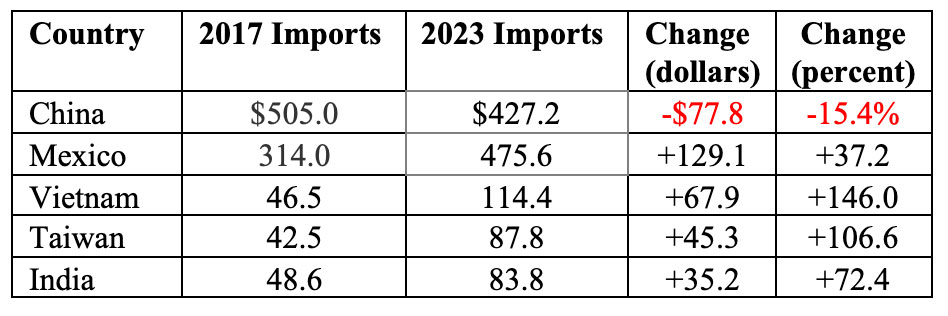
The tariffs implemented in 2018, particularly for China, caused many companies (for example, Nike) to turn away from China to source from other low labor cost countries. The table below shows the changes in imports of goods with selected low labor cost countries between 2017 and 2023. Imports from China declined $77.8 billion, or 15.4%, while imports from other low labor cost countries surged as the increased tariffs caused U.S. companies to rely on resources from other countries. On a percentage increase basis, Vietnam was the big winner, with U.S. imports from Vietnam increasing 146.0% since 2017 to $114.4 billion in 2023. In terms of dollars, imports from Mexico increased the most. Between 2017 and 2023, imports rose $129.1 billion, a 37.2% increase since 2017. Global tariffs will limit sourcing options.
Changes in Imports of Goods with Selected Low Labor Cost Countries
(billions of dollars)
The question is: How much are Americans willing to pay for some manufacturing jobs to return to the U.S.?
For manufacturing jobs to return to the U.S., three factors need to be present: 1) capacity – firms need to have the property, plant, equipment, people, and necessary inputs to domestically manufacture currently outsourced products, 2) capability – firms must possess the technological ability, and 3) an acceptance by Americans of higher prices.
A mix of manufacturing and foreign sourcing can provide lower costs to manufacturers and lower prices to consumers. Firms can benefit from economies of scale and lower costs by focusing on manufacturing certain products and components while others are outsourced. Research and development can also be more focused. Resources, including labor, are limited. Manufacturing strategically important products is important for U.S. economic growth and minimizing the impact of any future supply chain disruptions. However, attempting to manufacture all products used by consumers and businesses would raise costs to businesses and lower the standard of living for consumers through increased prices.
The Federal Reserve and Interest Rates
The Federal Reserve is responsible for monetary policy – implemented primarily through targeting the federal (fed) funds rate by controlling the money supply. The fed funds rate is the overnight borrowing rate between banks, a very short-term interest rate that when changed, typically has a rippling effect through the financial markets. The Federal Reserve influences this rate by primarily controlling the money supply in the United States. The amount of money circulating in the economy has an impact on interest rates and credit conditions – more money, lower interest rates; less money, higher interest rates. The fed funds rate is increased when the Federal Reserve decreases the money supply by selling Treasury securities (technically called Open Market Operations). The fed funds rate is decreased when the Federal Reserve increases the money supply by buying Treasury securities. Changes in the fed funds rate generally affect savings and borrowing rates.
The Federal Reserve Reform Act of 1977 requires the Fed to direct its policies toward the dual mandate of achieving maximum employment and price stability and report regularly to Congress. The Federal Reserve has a specific definition for price stability, and seeks to achieve inflation at a 2% rate over the long-run as measured by the annual change in the Personal Consumption Expenditures (PCE) price index. When making monetary policy and interest rate decisions, the Federal Reserve focuses on price changes using the PCE index rather than the Consumer Price Index (CPI). Both indexes calculate the price level by pricing a basket of goods. The basket of goods for the two measures is slightly different, and the index weighting of goods is also slightly different. While the two are similar, the PCE index reflects how Americans are currently spending their money to a greater degree and more quickly adapts to changes in spending patterns.
The other part of the Federal Reserve’s dual mandate, achieving maximum employment, is more difficult to define. However, it became clear in the latter stages of the economic recovery in the last decade that an unemployment rate hovering around 3.5% could be sustained without leading to excessive inflation. In reality, it has been very difficult in recent history to move the unemployment rate below 3.5%, as there will always be a mismatch to some degree between the abilities of people looking for work and the skills required for available jobs. Since 1970, only one month had an unemployment rate below 3.5% – April 2023, at 3.4%.
In striving to achieve its dual mandate, the Federal Reserve acts in a nonpartisan, independent manner to balance economic growth (which affects employment) with inflation. The goals are met through the application of monetary policy, generally through changes in interest rates. Lower interest rates can increase consumer and business spending which fuels economic growth and boosts employment. However, too much economic growth, or economic growth when the economy is near full employment, can increase inflation. Higher interest rates can lower economic growth by reducing interest rate sensitive consumer and business spending, which generally lowers the demand for products and services and consequently inflation.
Pushing interest rates too high, however, could plunge the economy into a recession. It’s a balancing act for the Federal Reserve, setting interest rates neither too low nor too high, but at a level that promotes economic growth (and full employment) and price stability in the long-run. Setting the appropriate level for interest rates is particularly challenging when the Federal Reserve is trying to lower inflation when there are factors contributing to inflation that are largely outside of the Federal Reserve’s control.
The chart below shows the federal funds rate since January 2020. The economic contraction in early 2020 led to two interest rate cuts in March which returned the fed funds rate to its historical low of 0.00–0.25%, matching the rate that was implemented during the financial crisis. The historically low funds rate, combined with fiscal policy, helped spur an economic rebound. In 2022 the focus of the Federal Reserve, and central banks around the world, shifted to increasing interest rates to fight global inflation. From a historic low of 0.00 – 0.25%, the fed funds rate hit 5.25 – 5.50% in July 2023. The objective of the rate increases was to lower consumer and business spending, which in turn would lower inflation through reduced demand for goods and services even though global factors were the primary drivers of inflation.
The demise of global inflation led central banks around the world to cut interest rates in 2024. In September, the Federal Reserve finally provided a long-awaited interest rate cut, as the fed funds rate was decreased 50 basis points to a target range of 4.75%–5.00%. Two more 25-basis point cuts occurred in November and December, bringing the fed funds rate to 4.25%–4.50%. The rate cuts followed eleven rate increases that occurred across 2022 and 2023. In addition, the cooling of the U.S. labor market contributed to the Federal Reserve’s decision to cut interest rates.
At its March 2025 meeting, the Federal Reserve decided to keep the fed funds rate unchanged at 4.25%–4.50%. The Federal Reserve continued its projection for two interest rate cuts in 2025 and a yearend fed funds rate of 3.9%. Relative to its December 2024 economic forecast for 2025, expectations for economic growth declined while inflation increased. The Federal Reserve stressed that its economic projections were subject to a very high level of uncertainty, particularly stemming from the unknown effects of tariff policies. The changing nature of U.S. tariff policies increases the complexity for the Federal Reserve in instituting effective monetary policy.
Effective Federal Funds Rate, January 2020 – April 2025

The Federal Reserve makes interest rate policy projections based on economic expectations. The economic expectations for 2025 are certainly subject to revision, and tariff policies significantly raise the uncertainty. The Federal Reserve strives to act in a nonpartisan, independent manner to implement policies for the long-term benefit of the U.S. economy. Ultimately, providing the Federal Reserve maintains its independence, policy and interest rate decisions will be guided by their dual policy mandate of achieving maximum employment and price stability.
Economic Growth
After solid economic growth since 2021 driven by consumer spending, the effect of tariffs would be the primary question for economic growth in 2025. U.S. tariff policies increased economic uncertainty and fueled fears of stagflation, defined as low (if any) economic growth with inflation. Uncertainties with tariffs included the magnitude of tariffs, how long the tariffs would remain in place, reciprocal tariffs, products excluded from tariffs, when tariffs would affect prices, and the long-term impact of how foreign countries view the desirability of the United States as a trading partner and global leader.
The table below shows how changes in the four components of Gross Domestic Product (GDP) contributed to the change in U.S. economic growth since 2021. Economic growth is measured by changes in GDP, which is the value of goods and services produced in a given time period. Personal consumption accounts for approximately two-thirds of GDP, and personal consumption has been the key and consistent driver of economic growth. As indicated in the chart below, personal consumption contributed significantly more to GDP growth than investment spending (including business investment in equipment and inventories), government spending, or net exports. Since 2021 U.S. economic growth has been solid. Following the economic rebound in 2021, U.S. economic growth was 2.5%, 2.9%. and 2.8% in 2022, 2023, and 2024, respectively. In each year, the driving force of the economy was personal consumption. In March 2025, retail sales rose to a record high as consumers stocked up before tariffs hit.
Contributions to Percent Change in Real Gross Domestic Product–Annualized Rate

In 2025, tariffs are a driving force influencing growth expectations. Even before the “reciprocal” tariffs were announced in April, Americans became leery of economic performance in 2025. According to surveys by the University of Michigan, consumer sentiment, which can influence consumer spending, tanked in 2025, with sentiment dropping 28% in March from its level one year ago. Inflationary expectations for one year from now climbed to 5%. The combination stoked concerns over stagflation.
Financial Markets
The Stock Market
The stock market reflects expectations for future economic performance, and those expectations have been rocked by U.S. tariff policies in 2025. The table below compares major stock index returns for selected countries for 2023, 2024, and 2025. The selected indexes are broad measures of stock market performance in their respective countries. The U.S. S&P 500 is a leading benchmark index for U.S. large company (large-cap) stocks, with a long-run historical annual average return of approximately 10%. The U.S. stock market soared in 2023 and 2024, with returns more than twice the historical average. In 2024, the U.S. stock market was the leader of the pack, with the S&P 500 returning 23.31%, slightly lower than the 2023 return of 24.23%.
Things changed in 2025. U.S. tariff policies caused increased economic uncertainty and growing fears of stagflation, which contributed to the S&P 500 declining in the first quarter of 2025 by 4.59%. The decline in the technology heavy NASDAQ index was even more severe, with a decrease of 10.42%. Contrary to recent years, the performance of the U.S. stock market lagged most foreign stock markets.
Volatility reigned in the stock market in April. Following the minimum 10% global tariff and “reciprocal” tariffs announced by the U.S. on April 2, U.S. and global stocks cratered, with the S&P 500 plummeting approximately 10% the following two days. On April 9, with the pause in “reciprocal” tariffs, the stock market had its best performing day in decades. The tech-heavy Nasdaq climbed 12%, its best day in 24 years, while the S&P 500 jumped 9.5%, its biggest gain since 2008. Alas, the rally was short-lived, with the S&P 500 and NASDAQ dropping 3.5% and 4.3%, respectively, the following day. The ups and downs for the stock market had returned. Economic uncertainties remained with the impact of the 10% global tariff and 100% plus tariff rate on imports from China, as well as the potential future return of the “reciprocal” tariff rates.
Global Stock Market Performance of Selected Indexes

Prior to 2025, four major market downturns occurred this century, defined as the S&P 500 dropping at least 25%. The chart below shows the peak month for the S&P 500 before the downturn, the month in which the trough occurred, and the number of months it took for the market to rebound to its prior peak.
U.S. Stock Market (S&P 500) Declines since 2000

The cause of the market decline in 2025 is much different than the causes of earlier market declines this century. There was no pandemic, financial crisis, dot.com crash, supply chain problem, or expected recession resulting from increasing interest rates. The market decline in 2025 resulted from U.S. tariff policies, the result which may be a fundamental change in the American economy and financial markets, as international trade, relations, and investments may be forever changed.
The Bond Market
Another side effect of the 2025 tariffs was the impact on Treasury bonds and international investing. The chart below shows the change in short-term and long-term interest rates between April 4 and April 11 for selected Treasury securities at different maturities. In one week, the yields on 5, 10, 20, and 30-year Treasuries each increased by at least 40 basis points. The dramatic jump in yields reflected the volatility in the bond market, as foreign investors bailed from U.S. Treasuries. Bond prices declined and consequently long-term bond yields increased. In addition, the declining demand for U.S. Treasuries weakened the dollar relative to foreign currencies. Uncertainty regarding future trade and relations with the United States prompted foreign investors to pull-back their investments.
Yield on Selected Treasury Securities by Maturity

The increase in long-term yields reflected the concern that international investors will no longer have a desire to invest in U.S. Treasury bonds, which typically are seen as a safe haven during periods of economic uncertainty. This would impact U.S. government financing through higher borrowing costs on U.S. debt. The increased interest rates would also negatively impact business and consumer borrowing. Foreign investors have played an important role in financing U.S. government debt. At the beginning of 2025, foreign investors held $8.5 trillion of Treasury securities, with Japan, China, and United Kingdom holding 12.6%, 8.9%, and 8.7%, respectively. Any drop in foreign investment which contributes to a weakened dollar, combined with tariffs, will only exacerbate inflationary expectations.
The Labor Market
Job gains continued in the first quarter of 2025; however, an important caveat is that the job market did not yet fully reflect newly implemented tariffs and DOGE government job cuts. Job gains occurred in March for the 51st consecutive month. The last time job losses occurred was December 2020. The table below shows monthly job changes since January 2020.
One Month Net Change in Employment (in thousands)
January 2020 – March 2025

(Source: U.S. Bureau of Labor Statistics)
The unemployment rate was a relatively low 4.2% in March; however, the rate has increased in 2025, up from 4.0% in January. Since February 2023, real wages have increased with wage growth exceeding inflation. The 3-month moving average of median hourly wage growth was 4.3% in March 2025, down from 4.7% in September 2024 but up slightly from December’s 4.2%.
Although job gains continued, the number of unemployed persons per job opening increased in 2025. The chart below shows the number of unemployed persons per job opening since January 2010. In February 2025, for the first time since March 2021, the rate exceeded 1.0, meaning that there was more than one unemployed person for every job opening.
Number of Unemployed Persons per Job Opening (January 2010 – March 2025)
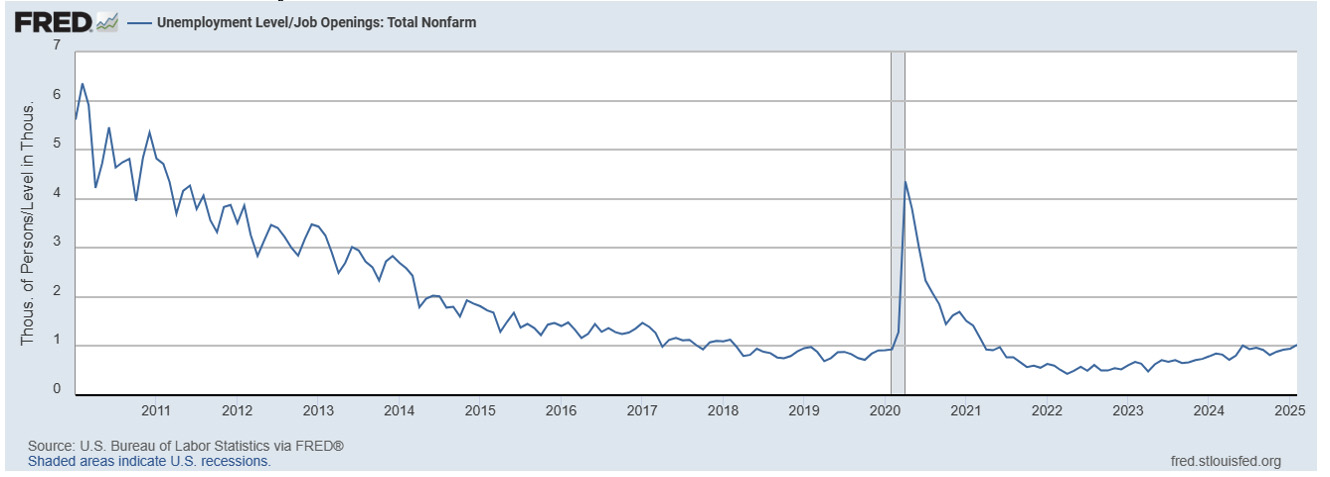
(Source: U.S. Bureau of Labor Statistics)
Inflation
The graph below shows the annualized U.S. inflation rate since June 2022, as measured by the twelve-month change in the Consumer Price Index and Personal Consumption Expenditure Price Index. The blue line measures the change in the Consumer Price Index for all items. The green line measures the change in the Personal Consumption Price Index.
The annualized inflation rate for all items in the CPI was 2.4% in March, decreasing from February’s 2.8%. The decline was primarily caused by a drop in energy prices, which decreased 2.4% in March. Food prices continued to climb, up 0.4% in March and 3.0% for the 12-months ended in March. The CPI all items less food and energy index (core inflation) rose 2.8 percent for the 12-months ended in March, the smallest 12-month increase since March 2021. Shelter (housing and rent) continues to be a primary driver of prices, increasing 4.0% for the 12 months ended in March, although it was the smallest 12-month increase since November 2021. The Federal Reserve targets a 2% inflation rate for Personal Consumption Expenditures. The PCE Price Index generally tracks slightly lower than the CPI, although both PCE and CPI measures remain above the Federal Reserve’s 2% target.
Percent Change in Consumer Price Index and PCE Price Index from One Year Ago
June 2022 – March 2025

Summary
The U.S. economy rolled into 2025 after four years of solid economic growth. Although all was not perfect, the momentum bode well for another year of solid economic growth in 2025 unless an economic shock occurred. It did, in the form of tariffs.
2025 became the year of the tariff. The United States implemented an aggressive tariff policy in an attempt to reshape global trade and manufacturing. The tariff rates were largely based on the U.S. trade deficit with a given country rather than the tariff rate charged by the foreign country on U.S. goods. The U.S. tariffs resulted in significant pushback from trading partners through reciprocal tariffs and reduced investment in the United States. The resolution of the tariff wars will likely be the driving force affecting the U.S. economy in 2025, and perhaps beyond.
Much remains to be determined with the continuing saga of tariffs. The ultimate resolution of tariff rates and tariff wars on economic growth, inflation, employment, and financial markets remains to be seen. However, there is no doubt that the tariff wars will reshape perceptions of the United States as a trading partner and its role in economic leadership.
For further information:
- From the U.S. Census:
- From Forbes: A History of Tariffs
- From the Council of Economic Advisors: Tariffs as a Major Revenue Source
- From the Congressional Research Service: U.S. Tariff Policy: Overview
- From the World Bank: U.S. Mean tariff Rate
- From the U.S. Census Bureau: U.S. Foreign Trade Data (see Exhibit 8)
- From the U.S. International Trade Administration (Trade Stats Express): Trade Data by State
- Info from the Bureau of Labor Statistics:
- From the Federal Reserve:
- GDP Growth (and other national data) from the Bureau of Economic Analysis: GDP Growth
- From the Atlanta Federal Reserve: Wage Growth Tracker
- CME FedWatch Tool: CME Fed Funds Futures
- From Investopedia: S&P 500 Average Return and Historical Performance
- From Morningstar:
- From Investopedia: What are the Top U.S. Imports?
- From the U.S. Census Bureau and Bureau of Economic Analysis:
- From the U.S. Treasury: The Yield Curve
- From the U.S. Census Bureau: Top Trading Partners
- From the World Bank: Global Manufacturing Employment as a Percent of Total Employment
- From the U.S. Treasury: The Yield Curve
- Major Holders of U.S. Treasury Securities from the U.S. Treasury: Foreign Holding of U.S. Treasuries

Kevin Bahr is a professor emeritus of finance and chief analyst of the Center for Business and Economic Insight in the Sentry School of Business and Economics at the University of Wisconsin-Stevens Point.
[…] The 2025 Spring Economic Scorecard – The Year of the Tariff, Chief Analyst Kevin Bahr provides a detailed overview of tariffs and their potential impact on the […]