While America awaits the ultimate impact of tariffs and trade wars on prices, this blog will provide an update on how prices have performed in the first half of 2025. The final resolution of tariffs, trade wars, and any trade agreements will take some time to work through the U.S. economy, and any trade agreement will only remain in force as long as both countries want it to be. Although overall inflation decreased as the year began, the rate of inflation disappointingly increased in May and June.
Inflation
The graph below shows the annualized U.S. inflation rate since June 2022, as measured by the 12-month change in the Consumer Price Index (CPI) for all items (blue line) and the Consumer Price Index, less Food and Energy (green line). Stripping out the relatively volatile categories of food and energy from the Consumer Price Index provides a measure of core inflation.
Percent Change in CPI and PCE Price Index from One Year Ago, June 2022 – June 2025
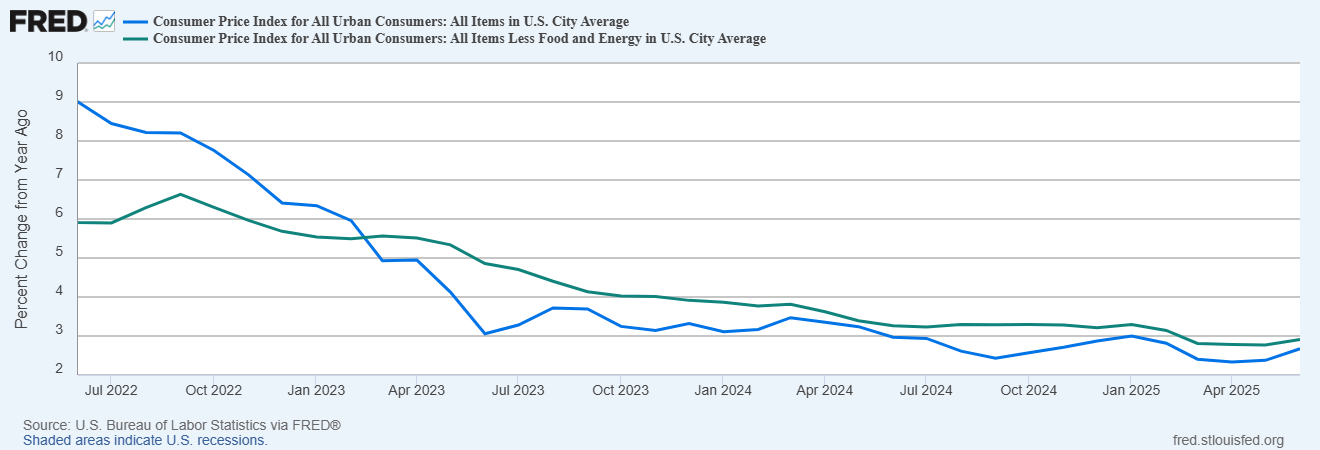
Recent inflation in the United States, as measured by the CPI for all items, peaked in June 2022 at 9.0%. From June 2022 through September 2024 inflation generally declined, bottoming out at 2.4% in September 2024 before gradually ticking up to 3.0% in January 2025. Inflation trended downward once again as 2025 began, decreasing to 2.3% in April, but disappointingly increased in both May and June. The annualized inflation rate as measured by the CPI for all items reached 2.7% in June, the highest inflation rate since February. Core inflation, measured by stripping out the relatively volatile food and energy categories from the CPI all items index, hit 2.9% in June, the highest level since February’s 3.1%. Core inflation had peaked in September 2022 at 6.6% before gradually declining and bottoming out at 2.8% in early 2025. Despite the declining trends in overall and core inflation that occurred through 2024, many Americans were hoping for a decline in prices (deflation) in 2025 rather than just a decrease in inflation (disinflation). Generally, that didn’t happen, and the increasing inflation rate as measured by the CPI for all items in May and June was particularly disappointing.
Prices
The table below shows the 12-month and June price changes by expenditure category, including some of the major price changes of sub categories. The initial impact of tariffs may have affected categorical price changes in June.
CPI by Expenditure Category, June 2025 One-Month (seasonally adj.) and 12-Month Changes
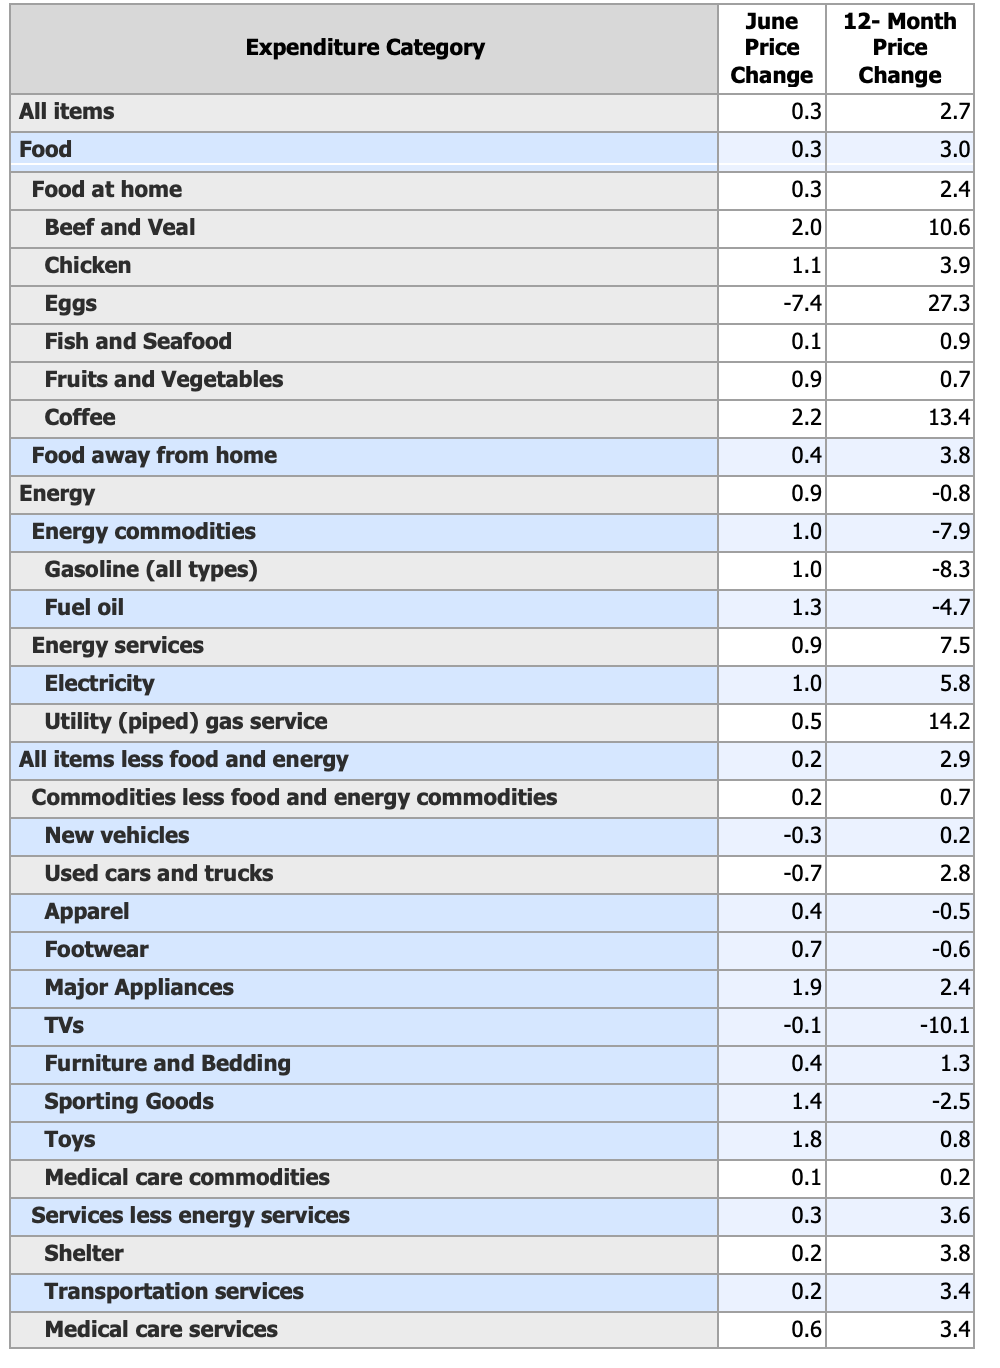
The annualized inflation rate for the CPI all items rose 0.3% in June and 2.7% over the past 12 months.
Overall food prices rose 3.0% for the 12 months ended June 2025, with food at home increasing 2.4% and food away from home rising 3.8%. Beef and veal prices rose significantly, increasing 10.6% over the past 12 months and 2.0% in the month of June. The decline of bird flu contributed to a drop in egg prices of 7.4% in June, although egg prices were still up 27.3% compared to a year ago. Your morning buzz got more expensive, with coffee prices increasing 2.2% in June and 13.4% over the past 12 months.
Overall energy prices declined 0.8% over the past 12 months, led by a decline in gas prices of 8.3%. However, energy services increased 7.5%, including a 14.2% price rise in utility gas service. Overall energy prices increased by 0.9% in June, with gas and energy services increasing 1.0% and 0.9%, respectively.
Despite relatively low inflation or price declines over the past 12 months, relatively high inflation occurred in June for apparel, footwear, major appliances, furniture and bedding, sporting goods, and toys, with June price increases ranging from 0.4% to 1.9%. Major appliances had the greatest monthly price increase at 1.9%, with sporting goods and toys having monthly price increases of 1.4% and 1.8%, respectively.
Shelter (housing and rent) has been a primary driver of prices in recent years. Shelter prices rose 0.2% in June while increasing 3.8% over the past 12 months.
Imports
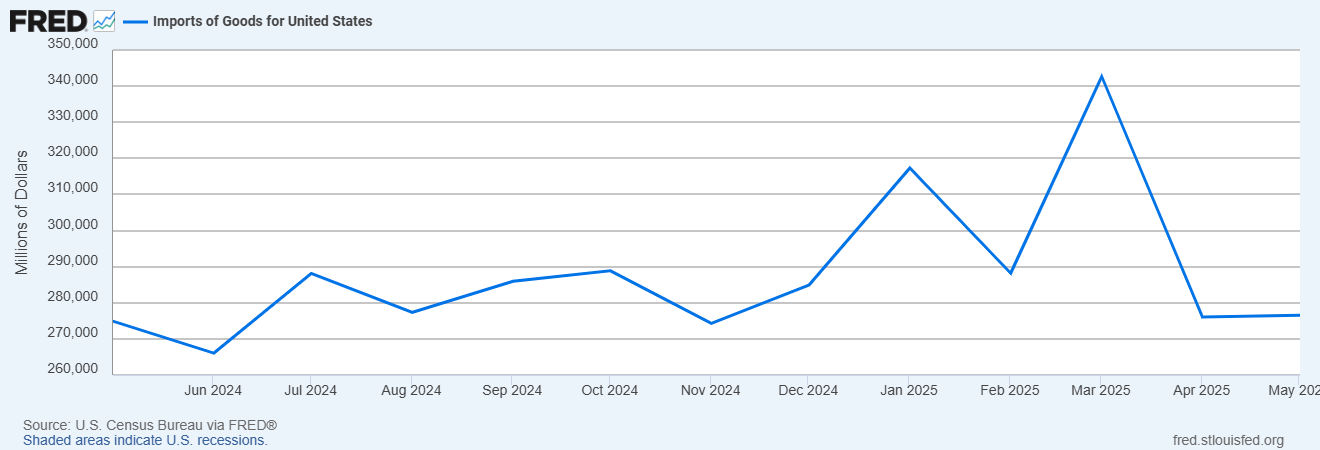
The final resolution of tariffs, trade wars, and any trade agreements, will likely take some time to work through the U.S. economy, including pricing effects. The graph below shows the United States imports of goods between May 2024 and May 2025. In early 2025 U.S. firms began ramping up imports to avoid expected “reciprocal” tariffs that would be implemented by the U.S. against trading partners in April. A tariff is basically a tax paid by a business to the U.S. government for importing goods from a foreign country. Tariffs are paid by the business importing the goods, not the foreign country sending the goods to the United States. Imports hit a record level in March 2025, exceeding $342 billion before dropping significantly to under $280 billion in April.
In April, the U.S. implemented “reciprocal” tariffs against trading partners, with fluctuating tariffs and policies occurring since. A major question is how long it will take for firms to work through imported inventory which was not subject to increased tariffs. The pre-tariff inventory ramp up can fend off price increases temporarily, but ultimately, firms may face increased costs through increased tariffs and/or production costs. This may translate to increased consumer prices.
United States Imports of Goods (May 2024 through May 2025)
Housing
Shelter, including housing costs, has been one of the primary contributors to inflation this decade. Since 2020, the cost of housing has made homebuying extremely difficult for Americans. Homebuyers faced the double whammy of increased home prices and rising mortgage rates.
The graph below shows the median sales price of houses sold in the U.S. (blue line, left-axis) and the 30-year fixed rate mortgage average (green line, right-axis) over the period from 2010 to 2024. Home prices began rising significantly in 2020, due to low financing costs combined with low inventory (active house listings).
Median Sales Price of Houses Sold and 30 Yr. Fixed Rate Mortgage Average 2010-2024
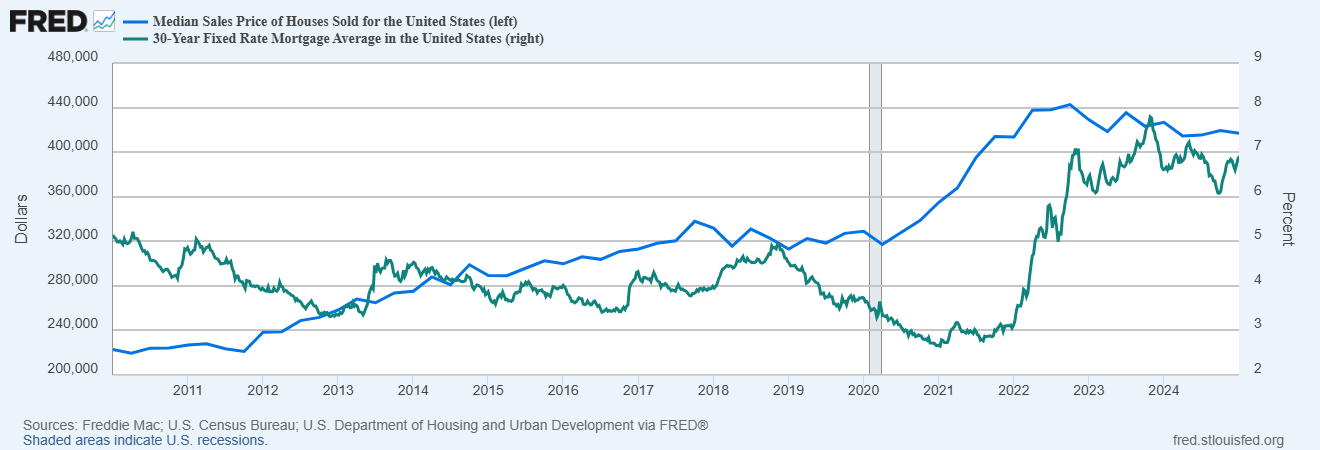
Active house listings began the decade (January 2020) at 951,699 before dropping to only 346,514 in February 2022, a drop of approximately 63%. Mortgage rates concurrently dropped with active house listings. The 30-year fixed rate mortgage average, influenced by interest rate cuts by the Federal Reserve, decreased in 2020 before bottoming out at approximately 2.65% in early 2021. Low mortgage rates generated a demand for housing in a period of low supply, which fostered a significant increase in home prices. Between the second quarter of 2020 and the first quarter of 2021, the median sales price of houses sold in the U.S. increased nearly 12%, from $317,100 to $355,000. The increase in home prices over the 3-year period from 2020 to 2022 was approximately 35%, compared to an approximate 46% increase over the entire last decade (2010 to 2019).
The Federal Reserve is responsible for monetary policy – implemented primarily through targeting the federal (fed) funds rate by controlling the money supply. The fed funds rate is the overnight borrowing rate between banks, a very short-term interest rate that when changed, typically has a rippling effect through the financial markets. In 2022, the Federal Reserve began raising the fed funds rate to combat inflation, which had a rippling effect on mortgage rates. From a historic low of 0.00 – 0.25%, the Federal Reserve increased the fed funds rate seven times in 2022 followed by another four rate increases in 2023. The fed funds rate hit 5.25 – 5.50% in July 2023. The 30-year fixed rate mortgage average climbed from a low of 2.65% in January 2021 to a peak of 7.79% in October 2023. The rise in mortgage rates, combined with increased active house listings, led to a moderation of home prices by late 2023. From a decade low of 346,514 in February 2022, active home listings more than doubled to 755,529 in November 2023. The median sales price of houses sold in the fourth quarter of 2023 was $423,200, down from a peak of $442,600 in the fourth quarter of 2022.
Although Federal Reserve policies influence mortgage rates, it is not the only factor that influences mortgage rates. U.S. government borrowing (including the demand for U.S. government securities), economic growth, and the demand for housing also affect mortgage rates. Mortgage rates fluctuated in 2024, initially declining but increasing later in the year. Relatively strong economic growth offset the effects of three interest rate cuts by the Federal Reserve, and the 30-year fixed rate mortgage average ended the year at 6.85%, relatively unchanged from the beginning of the year. The median sales price of houses sold in the fourth quarter of 2024 was $419,300, down slightly from $423,200 in the fourth quarter of 2023.
On the one hand, the Federal Reserve policy of increasing interest rates in 2022 and 2023 contributed to a significant increase in home financing costs, with the 30-year fixed rate mortgage average climbing from 2.65% in January 2021 to a peak of 7.79% in October 2023. On the other hand, the Federal Reserve policy of increasing interest rates helped bring price stability to the housing market. After increasing approximately 35% between 2020 and 2022, the median sales price of houses sold slightly declined in 2023 and 2024.
Uncertainty remains in the housing market and the future of housing costs for a variety of reasons. Tariffs may impact the cost of building supplies and consequently home prices. The ultimate impact of tariffs on inflation is yet to be seen, which will influence Federal Reserve policy on interest rates and consequently home financing costs. According to the Congressional Budget Office, the “One Big Beautiful Act” is expected to increase government debt by approximately $3 trillion over the next decade, which could adversely affect mortgage rates through increased government borrowing. Finally, the ultimate impact of tariffs, trade agreements, and trade wars on U.S. economic growth remains to be seen, which will consequently affect the demand for housing.
Summary
Inflation trended downward once again as 2025 began, decreasing to 2.3% in April, but disappointingly increased in both May and June. The annualized inflation rate as measured by the CPI for all items reached 2.7% in June, the highest inflation rate since February. Core inflation, measured by stripping out the relatively volatile food and energy categories from the CPI all items index, hit 2.9% in June, the highest level since February’s 3.1%. The initial impact of tariffs may have affected categorical price changes in June. Relatively high inflation occurred in June for coffee, apparel, footwear, major appliances, furniture and bedding, sporting goods, and toys, with June price increases ranging from 0.4% to 1.9%. Shelter, including housing costs, has been one of the primary contributors to inflation this decade. Uncertainty remains in the housing market and the future of housing costs for a variety of reasons. Tariffs can impact building supply costs, overall inflation, economic growth, and Federal Reserve policy, all of which may impact home prices and financing costs.
The Federal Reserve is charged with the dual mandate of achieving maximum employment and price stability. The Federal Reserve has a specific definition for price stability, and seeks to achieve inflation at a 2% rate over the long-run. The Federal Reserve influences the rate of inflation primarily through changing the fed funds rate, a short-term interest rate, which affects consumer spending through borrowing costs. Although inflation has significantly declined from its peak in 2022, the 2% target has proved allusive and recent increases in inflation have proved troubling.
The final resolution of tariffs, trade wars, and any trade agreements, will likely take some time to work through the U.S. economy, including pricing effects. In early 2025 U.S. firms began ramping up imports to avoid expected “reciprocal” tariffs that would be implemented by the U.S. against trading partners in April. Imports hit a record level in March 2025, exceeding $342 billion before dropping significantly to under $280 billion in April. A major question is how long it will take for firms to work through imported inventory which was not subject to increased tariffs. Ultimately, firms may face increased costs through increased tariffs and/or production costs which may translate to increased consumer prices.
For further information:
- Info from the Bureau of Labor Statistics:
- From the Congressional Budget Office: One Big Beautiful Bill Dynamic Estimate
- From Realtor.com through the Federal Reserve Economic Database (FRED): Housing Inventory: Active Home Listings

Kevin Bahr is a professor emeritus of finance and chief analyst of the Center for Business and Economic Insight in the Sentry School of Business and Economics at the University of Wisconsin-Stevens Point.