
2025 has been a turbulent year for tariffs and trade, with U.S. trade policy resulting in much international economic and trade uncertainty. Executive orders and trade deals have changed the tariff landscape on almost a weekly basis. Prior to 2025, global tariff rates were relatively low since early this century. That changed in 2025, when the United States increased tariff rates on imports from trading partners primarily based on U.S. trade deficits. A tariff is basically a tax paid by a business to the U.S. government for importing goods from a foreign country. Tariffs are paid by the business importing the goods, not the foreign country sending the goods to the United States. The ultimate questions are how tariffs will impact costs to businesses, prices to consumers, U.S. economic growth, changes in international trade, sourcing decisions by U.S. businesses, and U.S. economic leadership. The answers to these questions will take some time to be resolved. While tariffs can be implemented quickly, strategic and financial planning by U.S. and foreign businesses is a long-term process. Executive orders and trade deals have changed the tariff landscape on almost a weekly basis.
Tariff Rates Prior to 2025
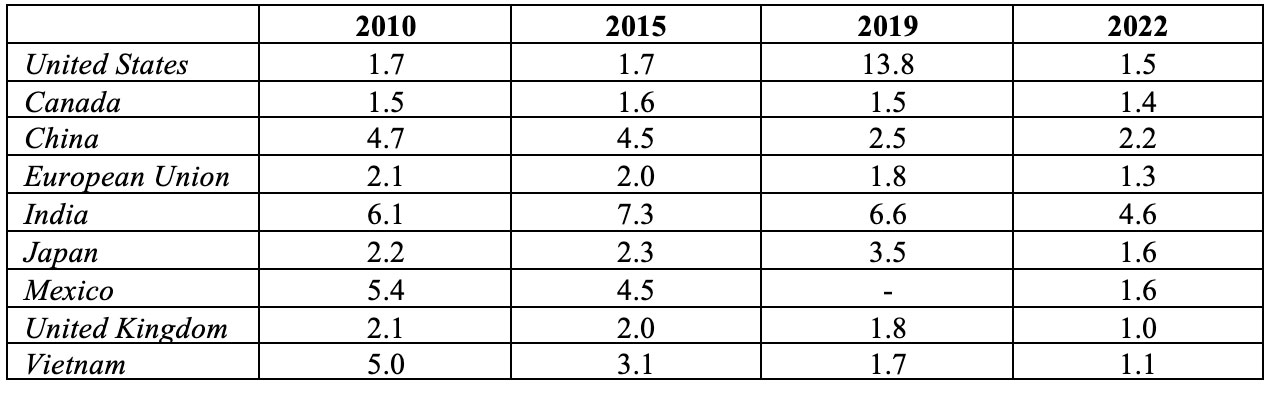
The table below shows the weighted mean applied tariff rate for the United States and selected trading partners. The weighted mean applied tariff is the average of effectively applied rates weighted by the product import shares corresponding to each partner country. Generally, global tariff rates have been relatively low and declining, as countries reaped benefits from international trade. The weighted mean tariff rate has generally been below 5% for most countries since 2010. A brief spike in the U.S. rate occurred in 2019 due to Trump Administration initiated tariffs, but trade wars rescinded in 2020 and tariff rates declined. The U.S. mean tariff rate had spiked to 13.8% in 2019 but declined to 1.5% in 2020.
The previous Trump administration negotiated trade deals with the United States’ three largest trading partners – Mexico, Canada, and China. Since 2020, the United States, Mexico, and Canada Trade Agreement (USMCA) governed tariffs and trade between the three countries. The USMCA modified the North American Free Trade Agreement (NAFTA), the original trade agreement between the three nations implemented in 1994. The USMCA covered approximately 40% of imports from Canada and 50% of imports from Mexico. The U.S. and China had also reached a new trade agreement in 2020. Collectively, Mexico, Canada, and China comprise over 40% of total U.S. trade.
Weighted Mean Applied Tariff (percent)
The era of low tariff rates ended in 2025, as the U.S. significantly raised tariff rates against its trading partners.
2025 U.S. Tariff Policy through April 2
The parade of 2025 U.S. implemented tariffs began in February when President Trump signed an executive order targeting Canada, Mexico, and China. Beginning in March, a 25% tariff tax was implemented on American businesses importing goods from Canada and Mexico. Tariffs were already in place on imports from China, but a new 10% (“broad”) tariff was implemented in February which doubled to 20% in March. Canada, Mexico, and China immediately responded with retaliatory tariffs on goods imported from the United States.
On April 2 (“Liberation Day”), the Trump Administration announced a minimum 10% global tariff rate, with country specific tariff rates ranging from 10% to approximately 50%. Although the Trump Administration referred to the new tariffs as “reciprocal”, the rates were not based on the tariff rates charged on U.S. imports by a given country. Rather, the “reciprocal” tariff rates were based on a mathematical formula: (trade balance/imports)/2. For example, the trade deficit with China in 2024 was $295.4 billion while imports were $438.9 billion. Dividing $295.4 billion by $438.9 billion equals 67%; dividing 67% by 2 and rounding equals 34%, the “reciprocal” tariff rate for China. The “reciprocal” tariff rate for Vietnam became 46%. The tariff formula used by the Trump Administration focused on trade deficits and did not take into account international trade in services, investments, or the size of a country’s economy.
The table below shows total trade, economy size (as measured by gross domestic product (GDP)), and the “reciprocal” tariff rate for the top ten U.S. trading partners. The size of the U.S. economy gives the U.S. leverage in many trade negotiations, as the U.S. is the largest potential market for the businesses of many countries. The size of the U.S. economy is also an important contributing factor to the U.S. trade deficit with many countries. Simply put, the U.S. can afford to buy more stuff from other countries than the amount other countries can afford to buy from the U.S. The size of the U.S. economy dwarfs the economies of many trading partners, being nearly 13 times the size of Canada’s economy and 65 times as large as Vietnam’s economy.
2024 Top Ten U.S. Trading Partners in Goods
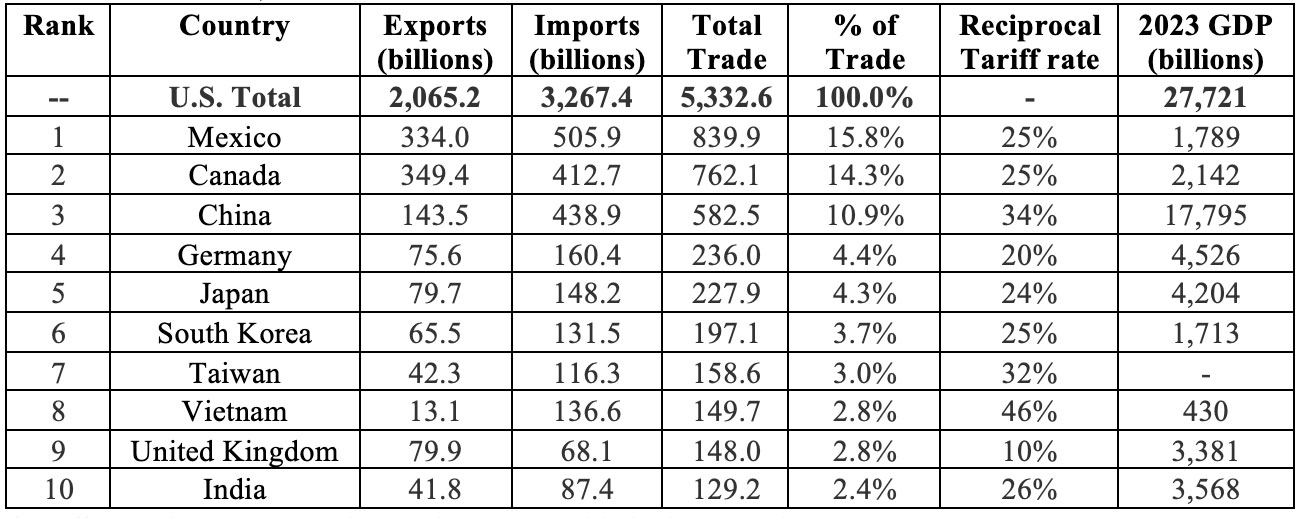
*tariff rates for Mexico and Canada were established in March
Germany is part of the European Union, which is a trading block of 27 European countries. Collectively, the E.U. is the largest trading partner with the United States. U.S. total trade in goods with the European Union was an estimated $976 billion in 2024. U.S. goods exported to the European Union in 2024 were $370.2 billion while imports totaled $605.8 billion, resulting in a trade deficit of $235.6 billion in 2024. Germany is the largest trading partner with the U.S. in the European Union.
The April 2 U.S. “reciprocal” tariffs implemented by the Trump administration caused many countries to implement their own reciprocal tariffs, with the new tariff rates a function of the rate that the U.S. had placed on imports from their country.
The Pause
The reciprocal tariff rates announced by the U.S. on April 2 were just the beginning of a roller coaster ride for tariff rates. On April 9, the Trump administration announced a 90-day pause from the “reciprocal” tariffs announced on April 2, although the global tariff rate of 10% remained in effect. August 1 became the deadline (later extended to August 7) for countries to negotiate trade deals with the U.S., or face the reimplementation of the “reciprocal” tariffs. The tariff and trade war escalated with China, and by the end of April the U.S. had a 145% reciprocal tariff rate on goods imported from China (with certain product exceptions) with China having a reciprocal rate of 125% on goods imported from the U.S. The 25% tariff rate (with certain product exceptions) was paused for Canada and Mexico on products covered by the USMCA.
In some cases, tariff rates had changed once again by June 1. The following is a summary of the U.S. tariffs on imported goods that were in effect as of June 1:
- 10% global baseline tariff rate, with additional, specific tariffs (such as for fentanyl and unfair trade) stacked on to the baseline rate for selected products and countries.
- 125% reciprocal tariff on China lowered to 10% for 90 days on May 12; additional tariffs (fentanyl and unfair trade) applied to bring effective rate to 30-55% for most products.
- 25% tariff on all Mexican and Canadian imports excluding products covered in USMCA.
- Specific product tariffs:
- 50% tariff on all steel and aluminum imports; 0% on the U.K.
- 25% tariff on all automobiles, with an exemption for U.S. content and a discount through April 2027 on parts tariffs for U.S.-assembled autos; reduced to 10% on the first 100,000 U.K. imports.
- 10% tariff on Canadian potash and energy.
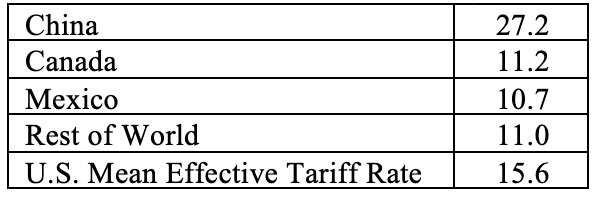
The table below shows the effective U.S. tariff rates as of June 1 for imports from American’s top three trading partners, the rest of the world, and the overall mean effective rate.
Estimated Effective U.S. Tariff Rates as of June 1
Summary of Trade Deals with Major Trading Partners after April 2 and August Tariff Rates
With an August deadline of U.S. tariffs reverting to the April 2 “reciprocal” rates unless trade deals were reached, multiple trade deals were finalized by the deadline. Four key factors should be considered when reviewing any trade deal: 1) The United States has the largest economy in the world, which consequently gives the U.S. leverage in many trade negotiations as the U.S. is the largest potential market for the businesses of many countries. 2) The tariffs imposed by the U.S. on imports from any country are paid for by the U.S. business importing the goods, not the country from where the goods are imported. It is in the best interests of foreign businesses and countries for the U.S. to have lower tariffs, since lower tariffs will generally mean that more goods are sold to the U.S. However, foreign countries and businesses don’t pay tariffs, the U.S. business importing the goods pays the tariff. The U.S. firm is faced with higher costs, potentially passing those costs onto U.S. consumers, or trying to negotiate lower prices with foreign businesses to help offset increased tariff taxes. 3) Any trade deal is in force only as long as both countries want it to be. 4) The new trade structure may change how the United States’ economic leadership is viewed by its trading partners.
The focus of the Trump Administration on trade has been an implicit objective of reducing or eliminating trade deficits with trading partners, with an added goal of increasing manufacturing jobs. The United States has the largest economy in the world and dwarfs the economies of many of its trading partners. Given the size disparity of economies, U.S. trade deficits resulting from relatively open trade are not surprising, given the ability of the United States to afford more goods. The effects of changes in U.S. tariff and trade policy will take years to discern, as U.S. corporations will have to consider the new and changing trade landscape into long-term strategic and financial decisions, including product sourcing, cost structure, product pricing, product mix, business investment, and changes in export and import markets.
Tariff rates may be “stacked” for a particular country, with the sum of multiple tariff rates determining the overall tariff rate. The Trump Administration has imposed baseline (general), Section 232, Section 301, and International Emergency Economic Powers Act (IEEPA) tariffs. A baseline tariff rate of 10% has been imposed on all countries. Section 232 tariffs target specific products deemed to impair national security. Section 232 tariffs include aluminum, copper, and steel tariffs. Section 301 tariffs address unfair trade practices and apply to specific countries or products. The IEEPA gives the president the authority to regulate economic transactions following a declaration of a national emergency. The Trump Administration became the first presidential administration to invoke tariffs based on the IEEPA. The “fentanyl” tariffs on Canada, China, and Mexico, and the “reciprocal” tariffs are examples of IEEPA tariffs.
A summary of the trade deals and tariffs effective in August for America’s top trading partners, listed in order by 2024 U.S. total trade in goods, is shown below. It should be noted that some of the details regarding the trade deals are yet to be determined, and there are certain product exemptions for any specific tariff. Tariffs and trade are subject to change, particularly in 2025. Executive orders and trade deals have changed the tariff landscape on almost a weekly basis. Any trade deal can be modified or rescinded, and more trade deals are possible.
- Mexico (2024 U.S. trade deficit $171.9 billion; total trade $839.9 billion)
On July 31, Mexico and the U.S. agreed to extend an existing trade deal for 90 days as talks continue to reach a new trade deal. The U.S. extended its 25% tariff on Mexico, excluding goods covered by the USMCA. The U.S. had indicated it would impose a 30% import tariff on August 1. - Canada (2024 U.S. trade deficit $63.3 billion; total trade $762.1 billion)
Trade talks continue between the U.S. and Canada, but as of mid-August, no new trade deal. As a result of failed trade talks, the U.S. implemented a 35% tariff in August on goods not covered by the USMCA, up from the previous 25% tariff rate that was in effect. Canada faces one of the highest tariff rates imposed by the Trump administration. - China (2024 U.S. trade deficit $295.4 billion; total trade $582.5 billion)
On August 11, the Trump Administration extended the deadline with China to negotiate a new trade deal for 90 days. The current tariff rate, 30%, was extended pending the new trade deal deadline. If a new trade deal is not reached, the U.S. has threatened higher tariffs. - Germany (2024 U.S. trade deficit $84.8 billion; total trade $236.0 billion)
Germany is the largest trading partner in the European Union for the United States. A new trade deal with the European Union includes a blanket tariff rate of 15% (U.S. had threatened to implement 30% on August 1) on all goods imported from the E.U., and an agreement by the E.U. to purchase $750 billion of American energy and increase investment in the U.S. by more than $600 billion. The 15% auto tariff on E.U. cars imported to the United States is lower than the 25% tariff American automakers pay if their cars are built in Mexico. The E.U. will not charge tariffs on most products imported from the U.S. Prior to 2025, the U.S. tariff rate on goods imported from the E.U. was approximately 1.2%. The “reciprocal” tariff rate on Germany had been 20%. - Japan (2024 U.S. trade deficit $68.5 billion; total trade $227.9 billion)
A new trade deal includes a 15% tariff rate on goods imported from Japan, and a commitment by Japan to invest $550 billion in the U.S. The “reciprocal” tariff rate had been 24%. - South Korea (2024 U.S. trade deficit $66.0 billion; total trade $197.1 billion)
A new trade deal includes a 15% tariff rate, down from the “reciprocal” tariff rate of 25%. South Korea also pledges to invest $350 billion in the U.S. - Taiwan (2024 U.S. trade deficit $74.0 billion; total trade $158.6 billion)
The U.S. imposed a 20% tariff in August on most goods from Taiwan, with further trade talks expected. The rate is lower than the 32% reciprocal rate announced in April. - Vietnam (2024 U.S. trade deficit $123.5 billion; total trade $149.7 billion)
A new trade deal with Vietnam includes a 20% tariff rate on goods imported from Vietnam and 40% on goods transshipped (goods from other countries shipped through Vietnam to the U.S.). The “reciprocal” tariff rate had been 46%. - United Kingdom (2024 U.S. trade surplus $11.8 billion; total trade $148.0 billion)
A new trade deal includes a tariff rate of 10% on goods imported from the U.K. The 10% tariff rate on vehicles imported from the U.K. only applies to a quota of 100,000 vehicles a year, which is approximately the number of cars currently sold into the US. Vehicles exceeding the quota face a 25% tariff. U.K. steel exported to the U.S. is subject to a 25% tariff, which is lower than the 50% global rate. The “reciprocal” tariff rate had been 10%. - India (2024 U.S. trade deficit $45.6 billion; total trade $129.2 billion)
No new trade deal as of mid-August, resulting in the U.S. implementing an additional 25% tariff rate on August 27 on top of the existing 25% tariff rate. The resulting 50% tariff rate is the highest rate of any top trading partner. The “reciprocal tariff” rate had been 26%.
Generally, the U.S. has implemented a 10% global minimum tariff rate and a 50% global tariff rate on imported steel and aluminum. The Yale Budget Lab estimated an overall average effective tariff rate of 18.6% for the United States in early August, the highest since 1933.
Summary
The era of low tariff rates ended in 2025 for the United States, with a pivot from relatively free trade to protectionism. The “reciprocal” tariff rates introduced by the U.S. on its trading partners on April 2 were subsequently delayed until August, with the intention of developing new trade agreements or trading partners facing an implementation of the “reciprocal” tariff rate. The U.S. overall average effective tariff rate climbed from approximately 2% to start the year to over 18% by August. A focus of the Trump Administration has been reducing or eliminating trade deficits with trading partners, but the size of the U.S. economy relative to its trading partners results in significantly greater consumer purchasing power in the United States.
The near-term effects of the new tariff policy are starting to be realized, but the long-term effects may take years to develop. Tariff tax revenue has significantly increased, with July 2025 tax revenue of approximately $25 billion more than tripling from $7 billion late last year. Although tariff tax revenue has increased significantly, it still makes up a relatively small percentage of total government revenues. According to the U.S. Treasury, in fiscal year 2025 through July, cumulative customs duties and tariffs totaled $136 billion, less than 5% of total government revenues of $4,347 billion. (The government fiscal year ends in September.)
However, the ultimate question, yet-to-be determined, is how much in tariff taxes businesses will pay and how much will be passed through to consumers. In July, the producer price index (PPI), which measures the change in prices at the wholesale level, rose 0.9% from June. The PPI measures prices based on the first commercial transaction for a product or service, and reflects the changes in prices received by domestic producers of goods and services. The July jump was the largest one month increase since June 2022. The PPI is generally a precursor to changes in consumer prices.
A slowing job market was also indicated in July, with only 73,000 jobs added to the economy and little change in job growth since April. The weak job numbers prompted the Trump administration to fire the head of the Bureau of Labor Statistics, which provides data on the U.S. labor market. Another objective of the tariffs is to increase manufacturing employment in the United States. Through July, manufacturing employment was down slightly for the year, with manufacturing employment of 12.727 million in July compared to 12.755 million in January.
The ultimate impact of the new tariff policy on the U.S. economy remains to be seen, and may take years to fully realize. U.S. corporations will have to consider the new and changing trade landscape in making long-term strategic and financial decisions, including product sourcing, cost structure, product pricing, product mix, business investment, and changes in export and import markets. U.S. corporations will have to weigh long-term strategic and financial decisions against the current political, trade, and economic environment, and how those factors may change. The effects of the new tariff policy will also impact consumer prices, economic growth, taxes, wealth distribution (tariffs are a regressive tax), and potentially how the economic leadership of the U.S. is viewed by its trading partners.
In 2025 through August, U.S. tariffs, trade, and international relations changed significantly. Stay tuned, it’s likely the changes are not over.
For further information:
- From the Budget Lab at Yale University:
- From CNN: Trump Announces Agreement to Pause Higher Tariffs on Mexico for 90 Days
- From the BBC:
- From the Peterson Institute of International Economics: U.S. China Trade War Tariffs
- From China Briefing: Breaking Down the US-China Trade Tariffs: What’s in Effect Now?
- From the Independent: Trump Delays China Tariffs and Announces 90 day Truce
- From the World Bank: Tariff Rates, Weighted Mean
- From Politico: U.S. and Vietnam have Reached Loose Framework for Deal
- From Politico: U.S. and South Korea Reach Trade Agreement
- From the Hill: Countries Without Trade Deals
- From Reuters:
- From Tariff Check: Tariff Deals
- From Husch Blackwell – International Trade Insights: Summary of Tariff Requirements
- From Avalara: The Difference Between Tariffs
- From the Committee for a Responsible Budget: Tariffs are Generating Meaningful New Revenue
- From Investopedia: Producer Price Index (PPI): What It Is and How It’s Calculated
- From the Bureau of Labor Statistics:
- From the U.S. Treasury: Fiscal Data

Kevin Bahr is a professor emeritus of finance and chief analyst of the Center for Business and Economic Insight in the Sentry School of Business and Economics at the University of Wisconsin-Stevens Point.