
By historical standards, the U.S. unemployment rate was at a relatively low 4.3% in August. Dissecting the overall unemployment rate into the unemployment rate for various worker groups, however, provides greater insight and a different perspective on the labor market. This blog will take a look at some of the labor market challenges for various worker groups, despite the relatively low unemployment rate.
The Overall Unemployment Rate
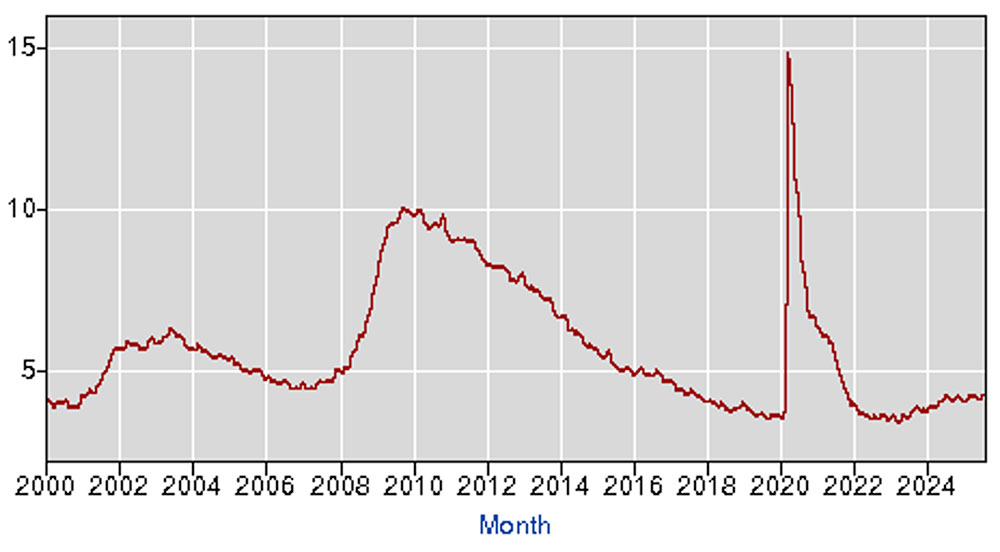
The chart below shows the unemployment rate since the turn of the century. The unemployment rate is the percentage of unemployed people in the labor force that are willing and available to work and who have actively sought work within the past four weeks. Although the unemployment rate has recently been at historically low levels, the rate has been trending up since the April 2023 low of 3.4%.
The unemployment rate exceeded 5.0% for much of the first decade this century, peaking at 10.0% in October 2009 as a result of the financial crisis that began in late 2007. The rate gradually declined throughout the last decade, marking the longest period of economic growth in U.S. history beginning in the third quarter of 2010 and continuing through April 2020. The rate began the decade at 9.8% in January 2010 and ended the decade at 3.6% in December 2020. The unemployment rate skyrocketed with the onset of COVID, hitting 14.8% in April 2020. This decade, the rate bottomed out at 3.4% in April 2023 as the economy quickly recovered, the lowest unemployment rate since 1969. Since then, the rate has generally trended upward, increasing to 4.3% in August 2025, up from the 4.0% at the start of the year.
Unemployment Rate January 2000 – August 2025
Gen Z and Recent College Grad Unemployment
The job market has been particularly challenging for Gen Zers (born between 1997 and 2012), both for those with and without college degrees.
The graph below compares unemployment rates for four different worker groups: 1) Recent college graduates, workers aged 22 to 27 with a bachelor’s degree or higher (blue line), 2) Young workers, defined as workers aged 22 to 27 without a bachelor’s degree (grey line), 3) All college graduates, workers aged 22 to 65 with a bachelor’s degree or higher (red line), and 4) All workers, defined as workers aged 22 to 65 (black line). The graph shows unemployment rates for each group of workers from 1990 through the second quarter of 2025. Shaded areas indicate periods designated recessions by the National Bureau of Economic Research. The rates are seasonally adjusted and smoothed with a three-month moving average.
Unemployment Rates for Recent College Graduates versus Other Groups
1990 – June 2025
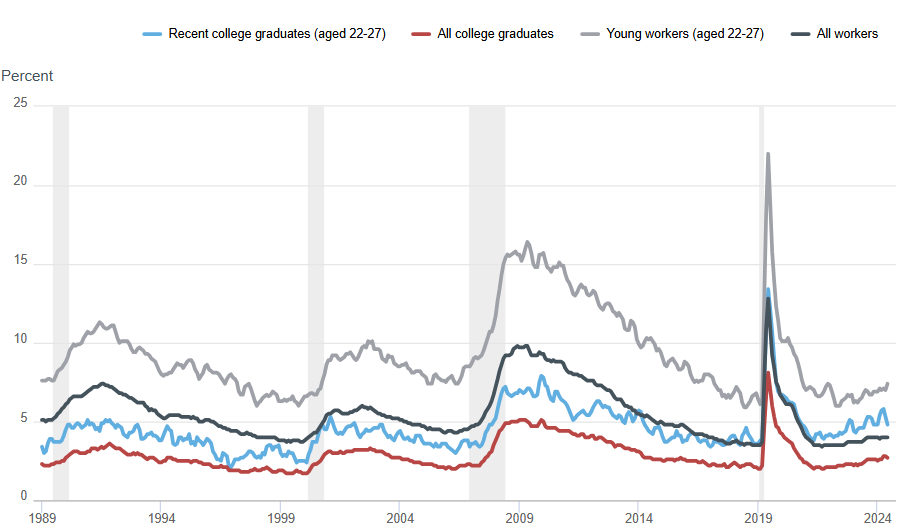
The unemployment rate for each group has generally been increasing since the overall unemployment rate bottomed out in April 2023. That trend continued in the first half of 2025, as the unemployment rate increased for each worker group. The job market has been relatively tough for Gen Zers, with both recent college graduates (ages 22-27) and young workers (no college degree, ages 22-27) having unemployment rates exceeding the overall unemployment rate. The unemployment rate for young workers (no college degree, ages 22-27) increased from 6.9% in January to 7.4% in June 2025. Although the unemployment rate for recent college graduates was unchanged at 4.8% in June when compared to January, the rate hit 5.8% in April. The unemployment rate for both groups of Gen Zers exceeded the overall unemployment rate, which rose to 4.1% in the first half of 2025. The unemployment rate for all college graduates rose from 2.5% to 2.7%.
Since 1990, young workers (no college degree, ages 22-27) have consistently had the highest unemployment while college graduates have consistently had the lowest. The unemployment rate for recent college graduates has been in between, being higher than the unemployment rate for all college graduates but lower than the unemployment rate for young workers (no college degree, ages 22-27). Relative to all workers, it’s been getting harder for recent college graduates to find a job. Prior to 2019, the unemployment rate for recent college graduates was lower than the unemployment rate for all workers. That changed in 2019, and since then the unemployment rate for recent college graduates has generally been higher than the unemployment rate for all workers.
An analysis by the Federal Reserve Bank of St. Louis shows how Gen Zers have faced the brunt of labor market shifts since 2019. The table below shows changes in the average unemployment rate when 2025 (January through July) is compared to 2019 for four different groups: 1) All workers, 2) Recent college graduates, workers aged 23 to 27 with a bachelor’s degree, 3) Older college graduates, workers aged 28 and older with a bachelor’s degree, and 4) Young noncollege-educated workers, individuals aged 23-27 without a bachelor’s degree. The rates are seasonally adjusted.
Unemployment Rates for College Graduates Relative to Noncollege Educated Workers
2019 vs. 2025
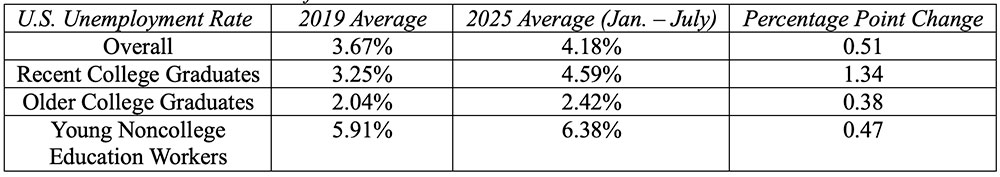
Relative to 2019, labor market softening has hit Gen Zers particularly hard, with recent college graduates bearing the brunt of a weaker jobs market. Recent college graduates saw a 1.34 percentage point change in the unemployment rate, from an average of 3.25% in 2019 to 4.59% in the first seven months of 2025. Young noncollege educated workers had the highest unemployment rate at 6.38% in 2025, but the percentage point change in unemployment was 0.47, significantly less than the increase for recent college graduates. The 1.34 increase in unemployment for recent college graduates reflects a significant shift in how the economy is absorbing newly educated workers. Older college graduates experienced only a 0.38 percentage point rise in the unemployment rate.
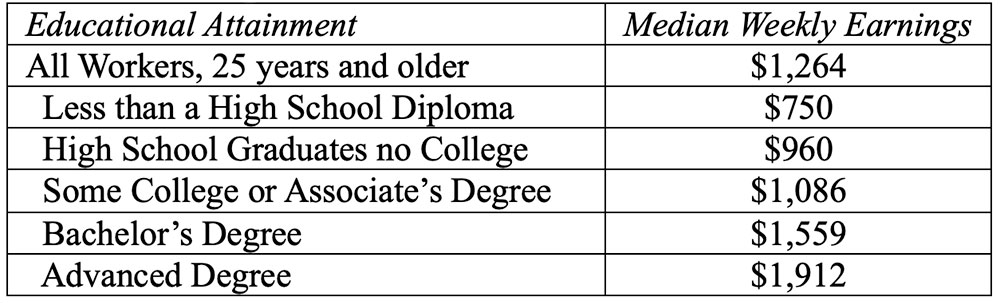
Although it has been getting more difficult for recent college graduates to find a job, earnings still remain correlated to educational attainment. The table below shows the median weekly earnings of workers (25 years and over) by educational attainment in the second quarter of 2025.
Weekly Earnings by Educational Attainment
Unemployment of Young Men Compared to Young Women
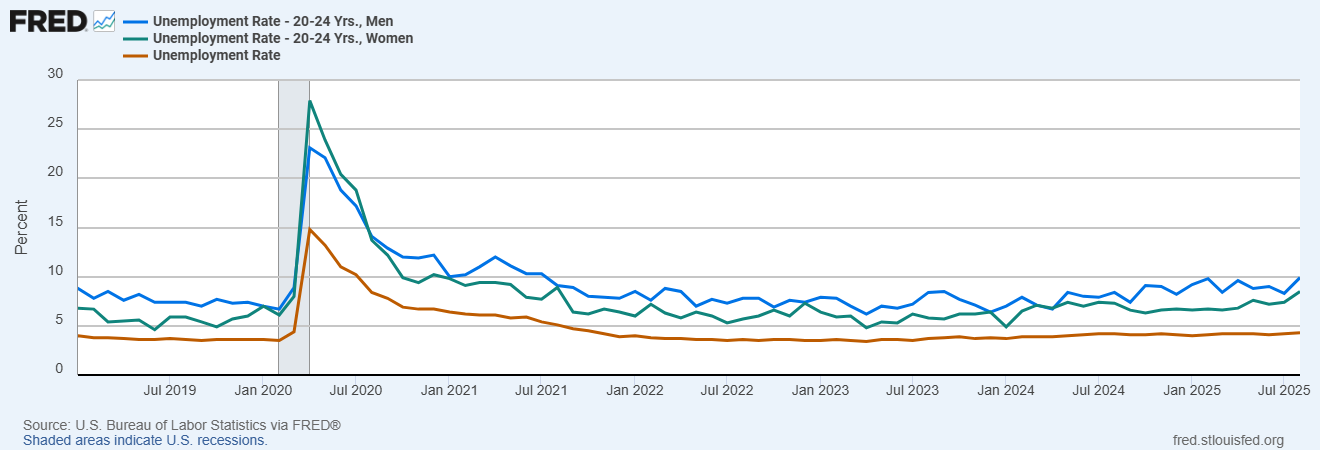
Young men have faced a particularly difficult labor market relative to young women, and recent softening in the labor market has negatively impacted both groups. The graph below shows the overall unemployment rate (red line), the unemployment rate of young men aged 20-24 years (blue line), and the unemployment rate of young women aged 20-24 years (green line) between January 2019 and August 2025. Historically, the unemployment rate of young men generally exceeds the unemployment rate of young women. An exception occurred with the COVID driven economic downturn in 2020.
In 2025 the unemployment rate for both young men and young women rose significantly. In August, the unemployment rate of young men was 9.9%, jumping from the December 2024 unemployment rate of 8.2%. The August unemployment rate for young men was the highest since July 2021. In August, the unemployment rate of young women was 8.5%, increasing from the December 2024 unemployment rate of 6.7%. The August unemployment rate for young women was the highest since August 2021.
Unemployment Rate: Overall, Young Men aged 20-24 yrs., Young Women aged 20-24 yrs.
January 2019 – August 2025
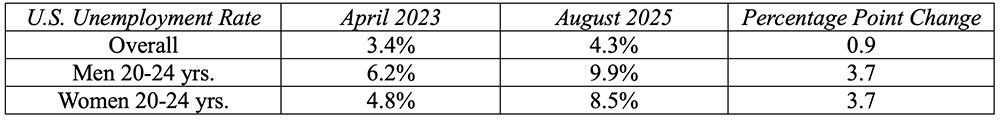
Relative to the overall unemployment rate, the jump in unemployment rates for both young men and young women saw a significant increase since the overall unemployment rate bottomed out at 3.4% in April 2023. The table below shows the change in unemployment rates since April 2023. Both the unemployment rate for young men and the unemployment rate for young women jumped 3.7 percentage points since April 2023, significantly greater than the 0.9 percentage point increase for the overall unemployment rate. The job market for young workers has been relatively tough compared to other workers, and in 2025 the job market for young workers continued to weaken.
Unemployment Rate for Young Men aged 20-24 yrs. and Young Women aged 20-24 yrs.
April 2023 vs. August 2025
Unemployment Rates by Race
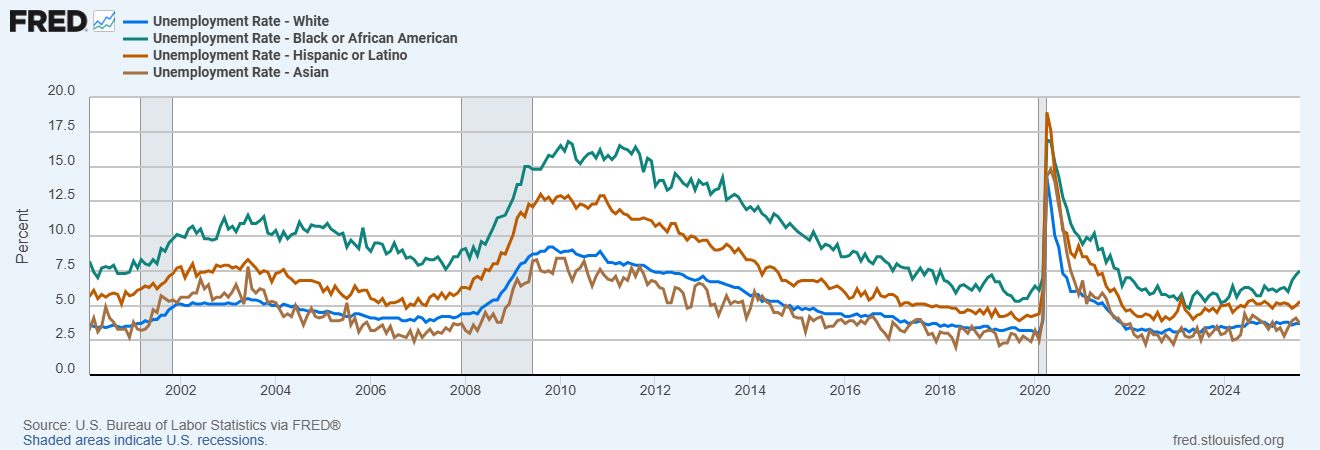
The graph below shows the unemployment rate since the turn of the century for four different groups: 1) White, 2) Black or African American, 3) Hispanic or Latino, and 4) Asian. Since 2000, a consistent pattern of unemployment rates shows that, generally, the unemployment rate of Black or African Americans exceeds the unemployment rate of Hispanic or Latinos, the unemployment rate of Hispanic or Latinos exceeds the unemployment rate of Whites, and the unemployment rate of Whites slightly exceeds the unemployment rate of Asians.
In 2025 the unemployment rate for all four groups increased. The unemployment rate for Blacks or African Americans rose from 6.1 % in December 2024 to 7.5% in August, the highest unemployment rate since 7.6% in October 2021. Black or African Americans continued to have the highest unemployment rate among the four groups. The August unemployment rate for Hispanic or Latinos was 5.3%, up from the December 2024 rate of 5.1%. The unemployment rate for Whites rose from 3.6% in December 2024 to 3.7% in August, while the unemployment rate for Asians increased from 3.3% to 3.7%.
Unemployment Rate by Race
2000 – August 2025
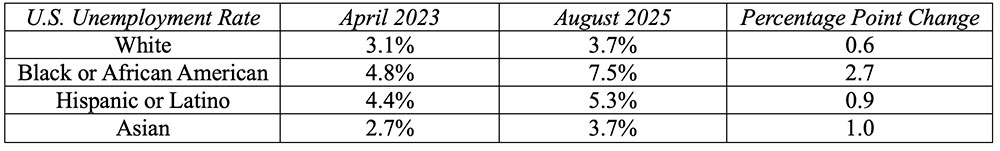
The table below shows the change in the unemployment rate for all four groups since the overall unemployment rate bottomed out at 3.4% in April 2023. Since April 2023, all four groups had unemployment rate increases, with the greatest increase for Blacks or African Americans at 2.7 percentage points. The unemployment rate increased by 1.0 percentage point for Asians, 0.6 percentage points for Whites, and 0.9 percentage points for Hispanic or Latinos.
Unemployment Rate by Race
April 2023 vs. August 2025
Job Openings and New Hires
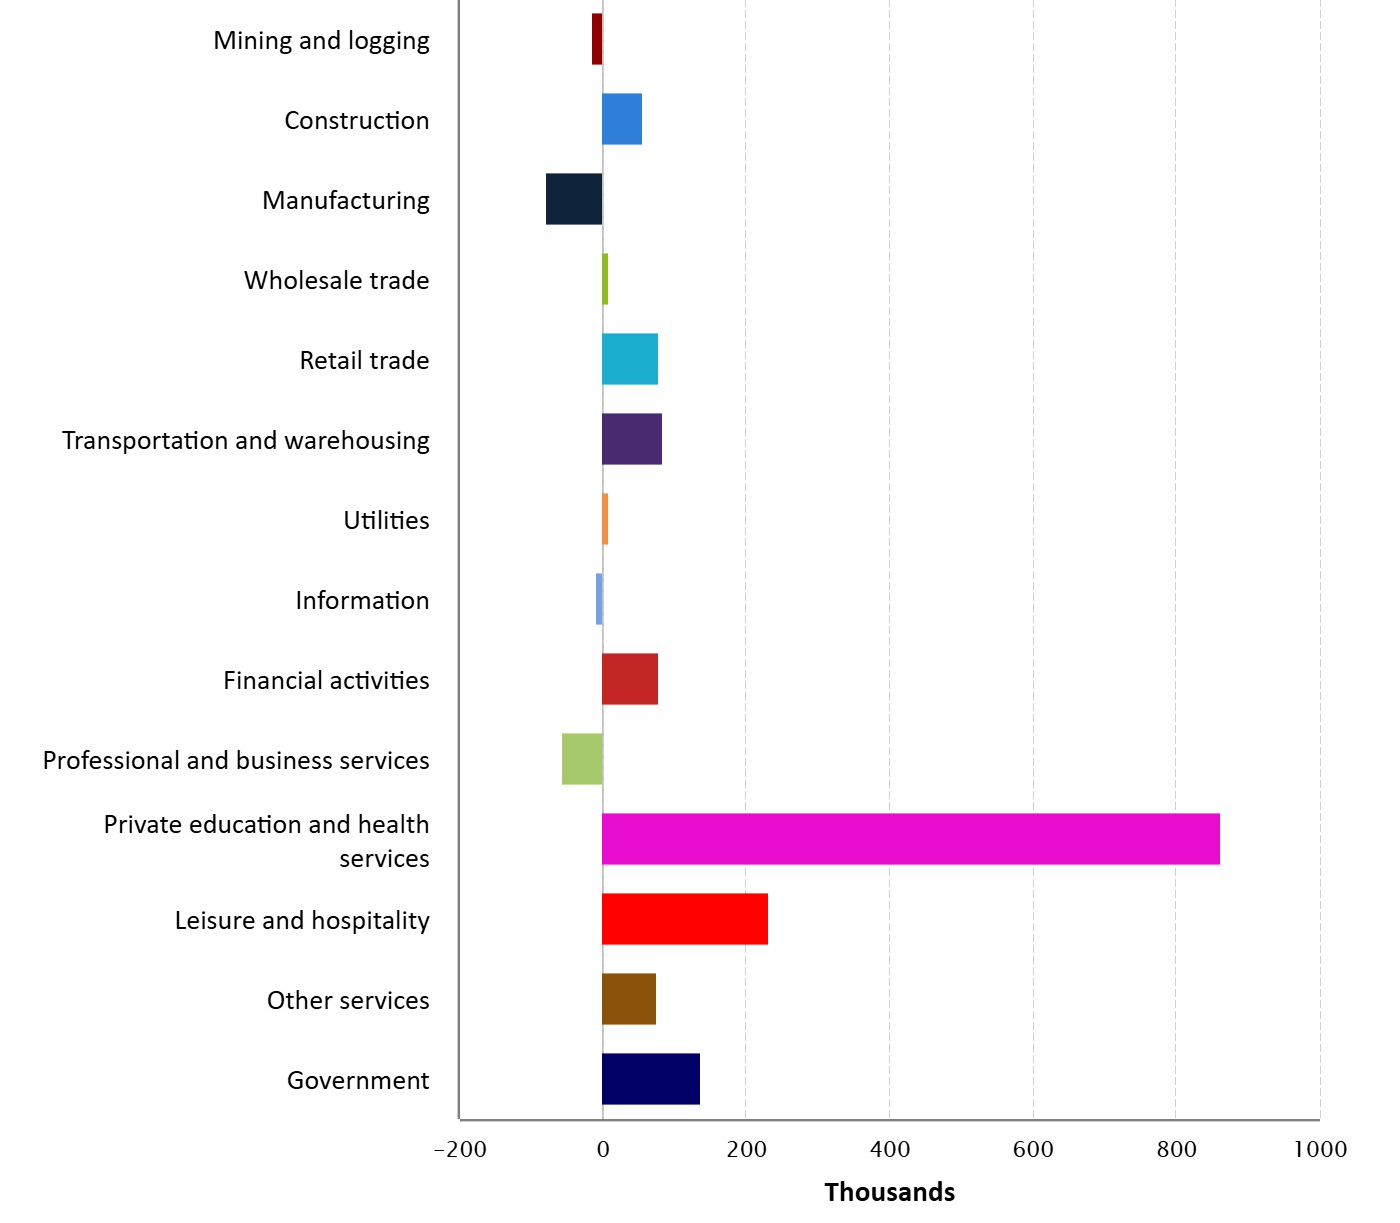
The chart below shows the change in employment for various industries for the twelve months ended August 2025. Private education and health services, occupations typically dominated by women, led the hiring with an increase of 862,000 jobs. Leisure and hospitality ranked second with an increase of 232,000 jobs followed by government which added 138,000 jobs. Manufacturing led job losses with 78,000.
Employment Change by Industry, 12 Months Ended August 2025
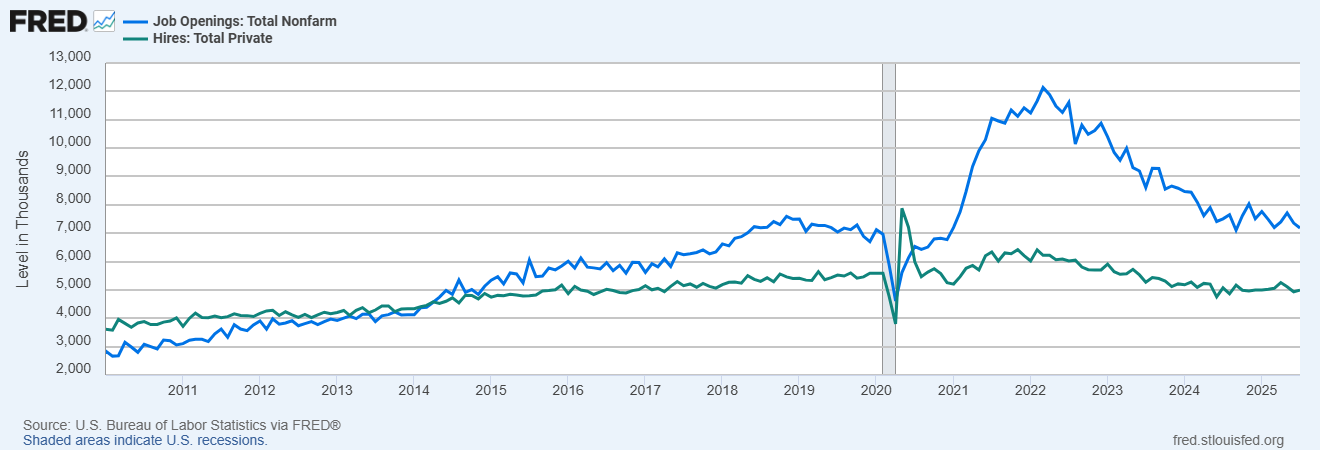
The graph below shows job openings (blue line) and new private sector hires (green line) from January 2010 through August 2025. Recent trends in both job openings and new hires reflect a softening labor market.
Following the financial crisis that began in late 2007, job openings and new hires gradually increased throughout the last decade. After significantly declining in 2020, new job openings spiked and peaked in March 2022 at 12.1 million. Since then, job openings have gradually declined to 7.2 million in August 2025, matching job opening levels in 2019. New hires have gradually declined since February 2022 and were at 5.0 million in August 2025. New hiring over the past twelve months has fluctuated between 4.8 and 5.2 million, the lowest level since 2017, excluding the 2020 economic downturn.
Job Openings and New Private Sector Hires
January 2010 – August 2025
Summary
The U.S. unemployment rate was at a relatively historical low of 4.3% in August, but different worker groups faced varying challenges in the current job market.
The job market has been relatively tough for Gen Zers, with both recent college graduates (ages 22-27) and young workers (no college degree, ages 22-27) having unemployment rates exceeding the overall unemployment rate. The unemployment rate for recent college graduates fluctuated in 2025 and was at 4.8% in June while the unemployment for young workers (no college degree) increased from 6.9% in January to 7.4% in June 2025.
Relative to other workers, it’s been getting harder for recent college graduates to find a job. Prior to 2019, the unemployment rate for recent college graduates was lower than the unemployment rate for all workers. That changed in 2019, and since then the unemployment rate for recent college graduates has generally been higher than the unemployment rate for all workers. However, the unemployment rate for young workers with no college degree continues to exceed the unemployment rate for young workers with a college degree. In the second quarter of 2025, there was still a strong correlation between weekly earnings and educational attainment.
A collage of factors likely contributed to the relative rise in unemployment for recent college graduates, including the increased number of college graduates in the workforce, the prevalence of economic uncertainty this decade, decreasing job openings and hires, and the rising presence of AI in the labor market. In 2025, the implementation of a volatile tariff policy created an additional layer of uncertainty for the economy and corporate financial and strategic planning, including hiring.
The labor market for young men and women (aged 20-24) has been difficult, with young men facing a particularly challenging labor market relative to young women. Recent softening in the labor market has negatively impacted both groups. In 2025, the unemployment rate for both young men and young women rose significantly. In August, the unemployment rate of young men was 9.9%, jumping from the December 2024 unemployment rate of 8.2%. The August unemployment rate for young men was the highest since July 2021. In August, the unemployment rate of young women was 8.5%, increasing from the December 2024 unemployment rate of 6.7%. The August unemployment rate for young women was the highest since August 2021. At least a partial explanation for the lower unemployment rate for women is given by recent industry job growth, which was led over the past twelve months by private education and health services, occupations typically dominated by women.
When analyzing the labor market by race, Blacks or African Americans have consistently had higher unemployment rates than other groups, and that trend continued in 2025. The unemployment rate for Blacks or African Americans rose from 6.1 % in December 2024 to 7.5% in August, the highest unemployment rate since 7.6% in October 2021. The unemployment rate for Blacks or African Americans has consistently exceeded the unemployment rate for Whites, Hispanic or Latinos, and Asians. The August unemployment rate for Hispanic or Latinos was 5.3%, up from the December 2024 rate of 5.1%. The unemployment rate for Whites rose from 3.6% in December 2024 to 3.7% in August, while the unemployment rate for Asians increased from 3.3% to 3.7%.
The overall unemployment rate might be historically relatively low, but significant labor market challenges exist for varying worker groups. In 2025, those challenges have increased, with unemployment rates increasing for most worker groups.
For More Information
- Info from the Bureau of Labor Statistics:
- Economic Situation
- Unemployment Rate
- Labor Force Statistics
- All Employees, Nonfarm Payrolls
- Job Openings and Labor Turnover
- CPS Tables : U.S. Bureau of Labor Statistics
- JOLTS Home: U.S. Bureau of Labor Statistics
- Employment by industry, monthly changes
- Earnings of Workers by Selected Characteristics, second quarter 2025
- From the Federal Reserve Bank of New York: Unemployment for Recent College Grads
- From the Federal Reserve Bank of St. Louis: Recent College Grads Bear Brunt of Labor Market Shifts
- From Fortune:
- From the World Economic Forum: Data shows that Gen Z face a deeply competitive job market | World Economic Forum
- From Newsweek: Gen Z are finding it hardest to get a job

Kevin Bahr is a professor emeritus of finance and chief analyst of the Center for Business and Economic Insight in the Sentry School of Business and Economics at the University of Wisconsin-Stevens Point.