Overview
The Federal Reserve is the key driver of short-term interest rates in the United States economy through its monetary policy, which is implemented primarily through targeting the federal (fed) funds rate. The fed funds rate is the overnight borrowing rate between banks, a very short-term interest rate that when changed, typically has a rippling effect throughout financial markets. Changes in the fed funds rate generally affect savings and borrowing rates, although the Federal Reserve’s monetary policy is not the only factor that influences savings and borrowing rates.
The Federal Reserve influences the fed funds rate primarily by controlling the money supply in the United States. The amount of money circulating in the economy has an impact on interest rates and credit conditions – more money, lower interest rates; less money, higher interest rates. The fed funds rate is increased when the Federal Reserve decreases the money supply by selling Treasury securities (technically called Open Market Operations). The fed funds rate is decreased when the Federal Reserve increases the money supply by buying Treasury securities. Generally, the fed funds rate is lowered to increase economic growth and consequently employment, and raised to reduce inflationary pressures.
The Federal Reserve sets the target for the fed funds rate at a level consistent with its dual mandate of achieving maximum employment and price stability. 2025 has been a challenging year for the Federal Reserve, as the uncertainties of the impact of tariffs on inflation contrasted with a softening labor market created a dichotomy for the direction of Federal Reserve policy. In September, in response to the softening labor market, the Federal Reserve implemented its first rate cut of the year, lowering the fed funds rate by 25 basis points to a target range of 4.00-4.25. Another 25-basis point cut occurred in late October, lowering the fed funds target range to 3.75-4.00. The CME FedWatch Tool provides insight as to what the financial markets expect for interest rates based on fed funds futures pricing. As of late-October, the financial markets anticipated another rate cut when the Federal Reserve Open Market Committee meets in December, but the Federal Reserve has indicated another rate cut is not a foregone conclusion.
Since 2016, the Federal Reserve has raised the fed funds rate 19 times and lowered it 10 times. This blog will analyze how these changes in the fed funds rate affected changes in other key financial market interest rates over the past decade.
Changes in the Fed Funds Rate
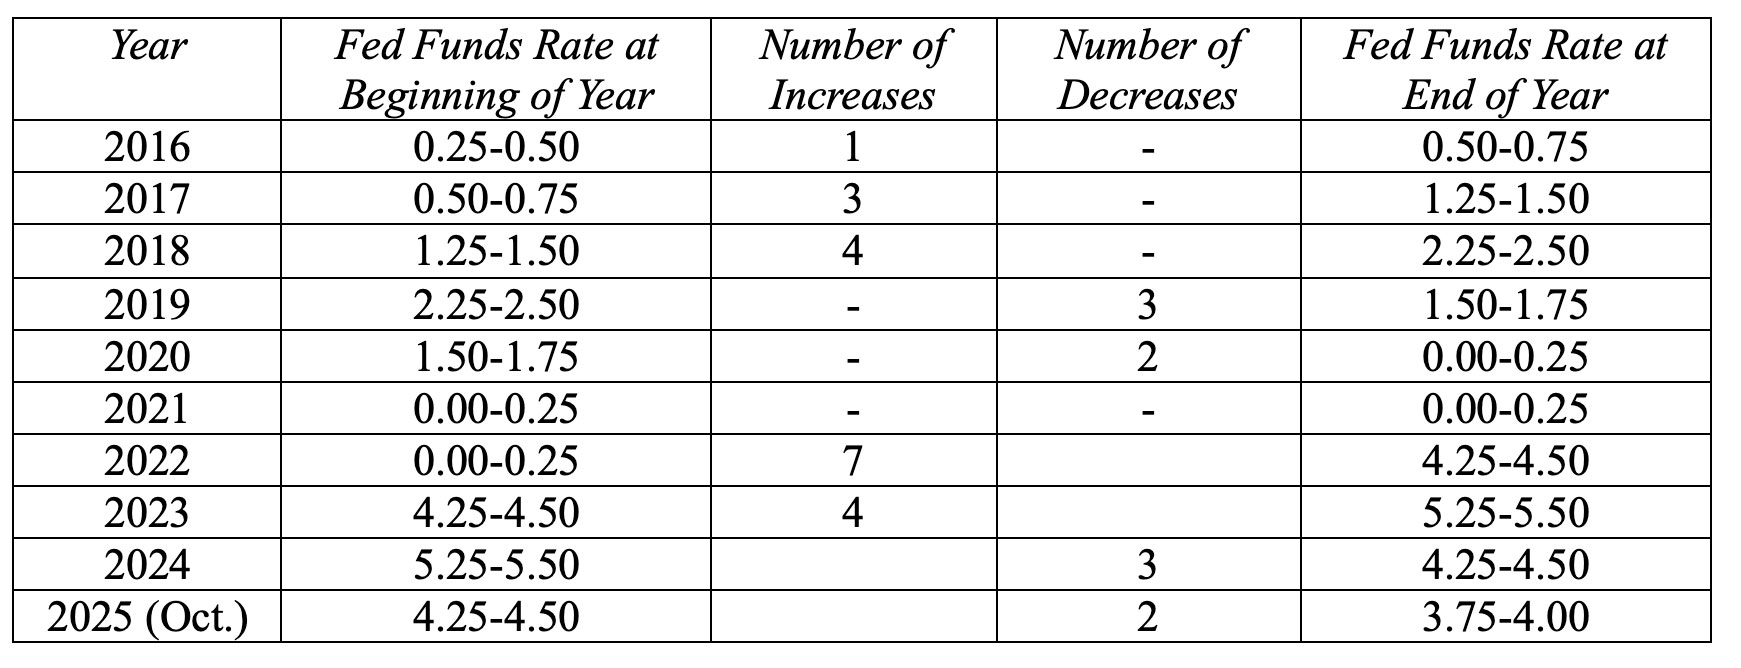
The table below shows the changes in the fed funds rate over the past 10 years.
The longest period of economic growth in U.S. history began in the third quarter of 2010 and continued through April 2020. The unemployment rate gradually declined and eventually dipped below 5% in 2016 and 4% in 2018. The expanding economy and relatively low unemployment rate raised concerns over inflation, and the Federal Reserve responded by raising the fed funds rate eight times in three years. Between 2016 through 2018, the fed funds rate increased from 0.25-0.50 to 2.25-2.50. Trade wars and slowing economic growth prompted three rate cuts in 2019, with the fed funds rate ending the year at 1.50-1.75. The severe economic downturn in 2020 precipitated two more rate cuts and brought the fed funds rate to a record low of 0.00-0.25 in March 2020. As the economy recovered and supply shortages arose, inflation rose rapidly resulting in 11 rate increases in just two years, 2022 and 2023. From a low of 0.00-0.25 in March 2020, the fed funds rate reached 5.25-5.50 by the end of 2023. As inflation subsided in 2024, three rate cuts occurred and the fed funds rate dropped to 4.25-4.50. A softening labor market in 2025 prompted two rate cuts, one in September and another in late October, lowering the rate to 3.75-4.00.
The Fed Funds Rate and Changes in the Prime Rate
The prime rate is defined as the interest rate that U.S. commercial banks charge their most creditworthy customers for loans. The rate serves as a base rate for various types of loans, including personal loans, small business loans, and credit cards. The most creditworthy customers can get prime rate loans; other customers will get an interest rate based on the default risk of the loan, with a percentage added to the prime rate. The Federal Reserve does not determine the prime rate, but banks typically tie their prime rate to the fed funds rate. The prime rate is generally set at approximately 3 percentage points above the federal funds rate by financial institutions. The prime rate was 7.25% in early October 2025.
The graph below shows the bank prime loan rate (blue line), the effective federal funds rate (green line), and the spread (difference) between the prime rate and the federal funds rate (orange line) from October 2016 through October 2025. The bank prime rate in the graph below is defined as the rate posted by a majority of top 25 (by assets) insured U.S.-chartered commercial banks. The effective federal funds rate is a volume-weighted median of overnight federal funds transactions reported by the Federal Reserve Bank of New York.
Bank Prime Loan Rate, Effective Federal Funds Rate, and Spread
October 2016 – October 2025
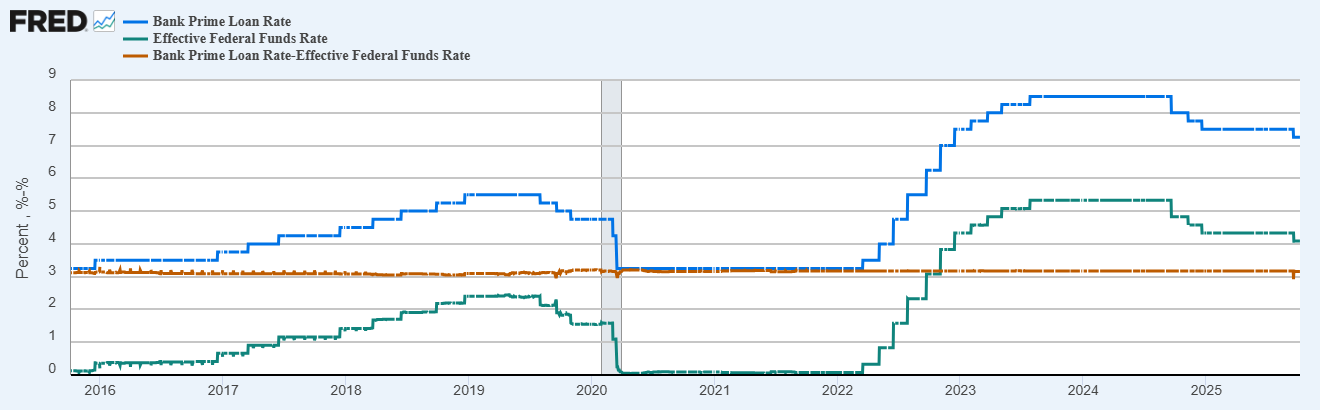
The graph shows that the prime rate moves in tandem with the fed funds rate. Changes in the fed funds rate cause a lock-step change in the prime rate. The graph indicates that the spread between the prime rate and fed funds rate has been locked in at approximately 3%. Changes in the fed funds rate will cause a corresponding change to the prime rate, and changes to the prime rate will affect the interest rate charged on a variety of bank loans to individuals and businesses.
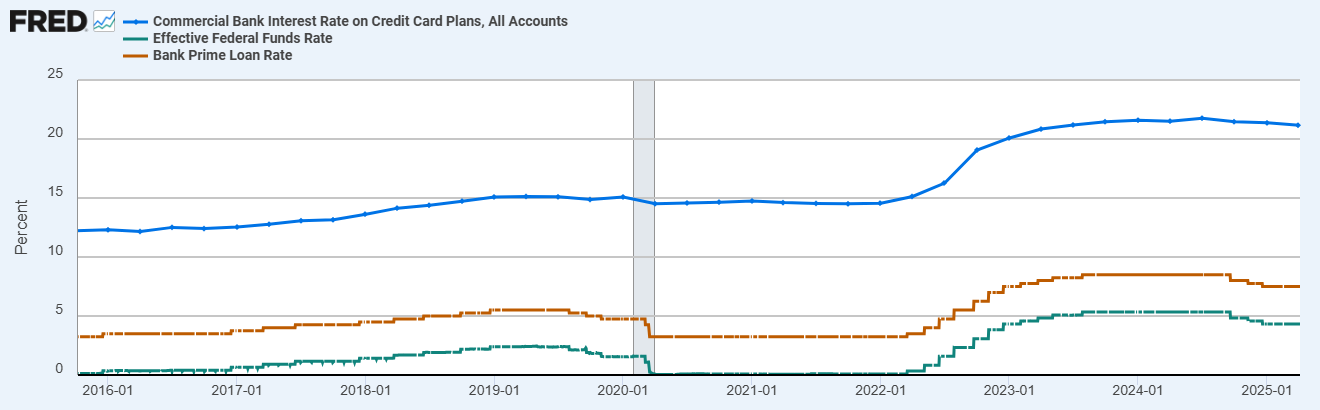
The prime rate serves as a base rate for the interest rate on credit card debt. Similar to the pattern of changes in the prime rate mirroring changes in the fed funds rate, changes in the commercial bank rate on credit card plans also mirror changes in the fed funds rate. The graph below shows the commercial bank rate on credit card plans (blue line), the bank prime loan rate (orange line) and the effective fed funds rate (green line). While the spread between the commercial bank interest rate on credit card plans and fed funds rate may vary slightly over time due to changing risk characteristics of credit card holders, the trends between the three rates are closely related, reflecting that the prime rate serves as a base rate for the interest rate on credit card debt. The commercial bank interest rate on credit card plans is greater than the prime rate, which is greater than the federal funds rate.
Commercial Bank Interest Rate on Credit Card Plans, Bank Prime Loan Rate, and Effective Federal Funds Rate
October 2016 – October 2025
The Fed Funds Rate and Changes in Mortgage Rates
The graph below shows the effective federal funds rate (blue line), the 30-year fixed rate mortgage average in the United States (green line), and the spread (difference) between the 30-year fixed rate mortgage average and the federal funds rate (orange line).
Although changes in the fed funds rate generally ripple through to changes in mortgage rates, other factors affect mortgage rates, such as the demand for loans by home buyers, home prices, inflationary expectations, and available funds by financial institutions. As a result, the magnitude of change in the federal funds rate is typically different from the magnitude of change in mortgage rates.
Between the beginning of 2016 and the end of 2018, the Federal Reserve increased the fed funds rate by 2.00 percentage points while the 30-year fixed mortgage rate rose by only 1.0 percentage point. In other words, the spread between the rates decreased as the increase in the 30-year fixed rate mortgage was less than the increase in the federal funds rate. While the fed funds rate held steady in 2019 between January and August, mortgage rates declined by over 1.0 percentage point. Between 2020 and March 2022 the spread between rates was relatively constant, with the 30-year fixed mortgage rate exceeding the fed funds rate by approximately 3.0 percentage points.
Effective Federal Funds Rate, 30-Year Fixed Rate Mortgage Average, and Spread
October 2016 – October 2025
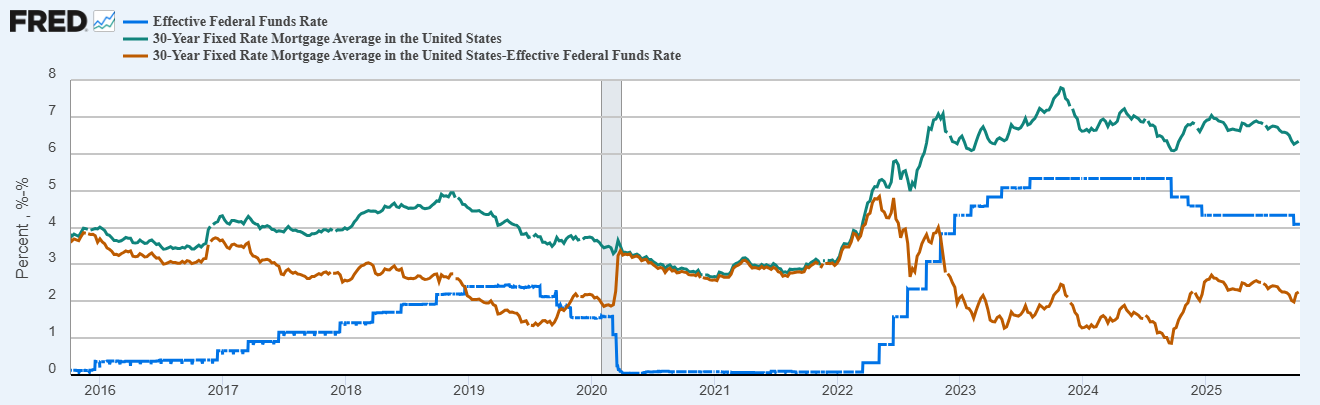
As the upward march of interest rates began in March 2022, 11 fed funds rate increases occurred through July 2023. Although the fed funds rate peaked at 5.25-5.50, the spread between the 30-year fixed mortgage rate and fed funds rate declined significantly, as additional factors other than changes in the fed funds rate affected mortgage rates. The spread declined from approximately 5.0 percentage points in early 2022 to only 1.0 percentage point in late 2024. The fed funds rate remained relatively constant at 5.25-5.50 between July 2023 and September 2024, but the 30-year fixed mortgage rate fluctuated and peaked at 7.76% in November 2023 before dropping to 6.09% in September 2024. Although three fed funds rate cuts occurred in late 2024 between September and December, mortgage rates generally moved in the opposite direction, increasing from 6.09% in September to approximately 7.00% by December. In 2025, the fed funds rate remained unchanged from January through August while mortgage rates fluctuated slightly and the spread remained relatively steady at 2.5 percentage points. In September, a slight decline in the 30-year fixed mortgage rate accompanied the fed funds rate cut.
While changes in the fed funds rate will generally move mortgage rates in the same direction, the magnitude of change in the federal funds rate is typically different from the magnitude of change in mortgage rates. Additional factors other than changes in the federal funds rate affect mortgage rates.
The Fed Funds Rate and Changes in Bond Yields
Changes in the fed funds rate generally affect short-term and long-term bonds differently. A bond’s yield is the rate of return an investor earns on the bond. While changes in the fed funds rate will generally move bond yields in the same direction, the magnitude of change in the federal funds rate may be different from the magnitude of change in bond yields. Additional factors other than changes in the federal funds rate affect bond yields, including the demand for a given type of bond, the supply of bonds offered by issuers, inflationary expectations, and the default risk of the bond.
To finance a budget deficit the U.S. government borrows money from the public through the issuance of U.S. government debt securities called U.S. Treasury securities. Buyers include individuals, institutional investors, certain mutual funds, and foreign investors and governments. Treasury bills are short-term securities with maturities ranging from 4 to 52 weeks while Treasury bonds are long-term securities.
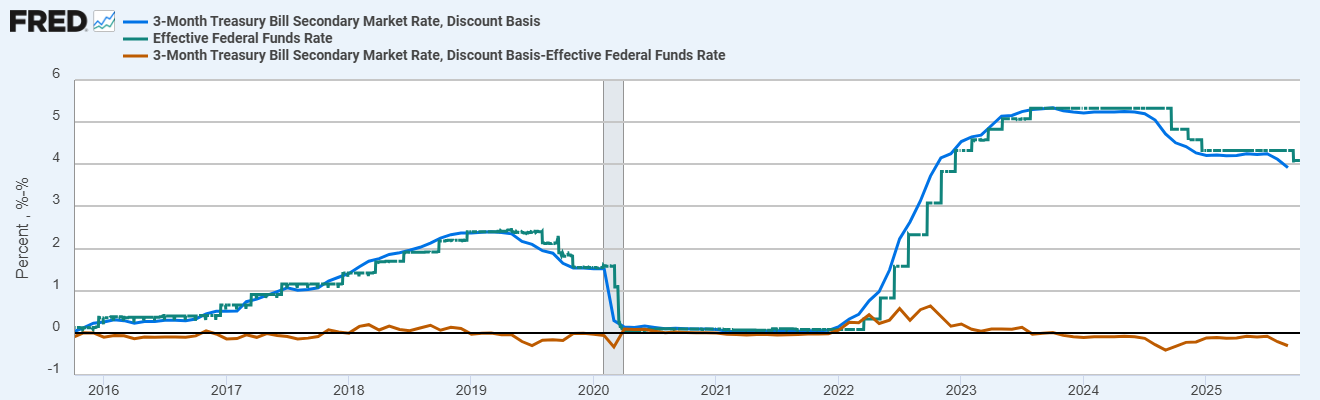
The graph below shows the effective federal funds rate (green line), the 3-Month Treasury Bill Yield (blue line), and the spread (difference) between the 3-Month Treasury Bill Yield and the federal funds rate (orange line). The graph shows that the 3-month Treasury Bill Yield generally mirrors the fed funds rate. Both are short-term rates. Over the past 10-years, the spread between the 3-month Treasury Bill Yield and fed funds rate has been negligible. Changes in the fed funds rate cause a lock-step change in the 3-Month Treasury Bill Yield. The spread between the two rates has hovered around zero over the past 10 years.
Effective Federal Funds Rate, 3-Month Treasury Bill Yield, and Spread
October 2016 – October 2025
The graph below shows the effective federal funds rate (green line), the 10-Year Treasury Bond Yield (blue line), and the spread (difference) between the 10-Year Treasury Bond Yield and the federal funds rate (orange line). Changes in the fed funds rate generally moved the 10-Year Treasury Bond Yield in the same direction, with increases in the fed funds rate causing increases in the 10-Year Treasury Bond Yield. However, the changing spread between the two rates indicates that the change in the 10-year Treasury Bond Yield generally differed from the magnitude of change in the fed funds rate. Contrary to the relatively constant spread between the federal funds rate and 3-Month Treasury Bill Yield, the spread between the federal funds rate and 10-Year Bond Yield varied. The federal funds rate and 3-Month Treasury Bill Yield are short-term rates; the 10-Year Treasury Bond Yield is a long-term rate. Different factors affect the rates, particularly the impact of inflation. Long-term inflationary expectations will affect the 10-Year Treasury Bond Yield, with investors desiring a rate of return greater than the rate of inflation. The 10-Year Treasury Bond Yield will also be impacted by the specific demand for and supply of the bonds.
Effective Federal Funds Rate, 10-Year Treasury Bond Yield, and Spread
October 2016 – October 2025
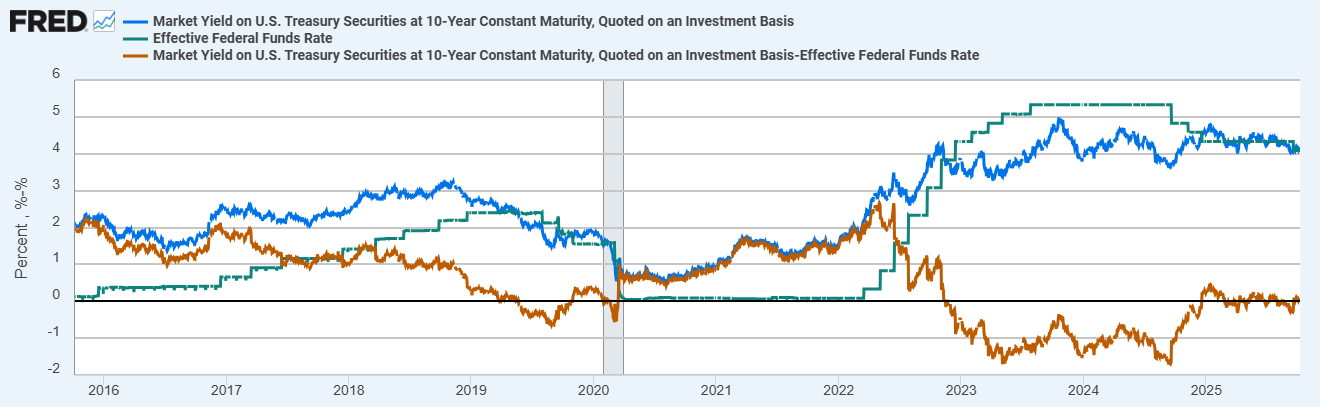
Although the trend in the 10-Year Treasury Bond Yield generally followed increases or decreases in the fed funds rate, the spread between the two rates varied. Between 2016 and 2020, the spread between the fed funds rate and 10-Year Treasury Bond Yield generally declined, beginning at approximately 2.0 percentage points in 2016 before declining to approximately zero in 2020. Beginning in March 2020, the spread gradually increased and peaked at approximately 2.60 in June 2022. The dramatic rise in the fed funds rate resulting from 11 rate increases that began in 2022 and continued into 2023 led to the fed funds rate exceeding the 10-Year Treasury Bond Yield in 2023 and 2024. An “inverted yield curve” occurred, with the 10-Year Treasury Bond Yield exceeding the 3-Month Treasury Bill Yield. In effect, short-term interest rates were higher than long-term interest rates, which created the inverted yield curve. In 2025, the spread has hovered around zero, indicating that the 10-Year Treasury Bond Yield was approximately equal to the fed funds rate.
Summary
The Federal Reserve is the key driver of short-term interest rates in the United States economy through its monetary policy, which is implemented primarily through targeting the fed fundsrate. Federal Reserve policy and changes in the fed funds rate are watched closely by the financial markets. Changes in the fed funds rate generally affect savings and borrowing rates, although the Federal Reserve’s monetary policy is not the only factor that influences savings and borrowing rates. In September, in response to a softening labor market, the Federal Reserve implemented its first rate cut of the year, lowering the fed funds rate by 25 basis points to a target range of 4.00-4.25. Another 25-basis point cut occurred in late October, lowering the fed funds target range to 3.75-4.00. As of late October, the financial markets anticipated another rate cut when the Federal Reserve Open Market Committee meets in December, but the Federal Reserve has indicated another rate cut is not a foregone conclusion.
Changes in the fed funds rate generally move other financial market interest rates in the same direction, but the magnitude of change in the fed funds rate may differ from the magnitude of change in other interest rates. Specific market factors can affect a given financial market interest rate in addition to movements in the fed funds rate.
The bank prime loan rate moves in tandem with the fed funds rate. The prime rate serves as a base rate for various types of personal and business loans, with the most creditworthy customers getting prime rate loans and other customers getting an interest rate based on the default risk of the loan, with a percentage added to the prime rate. Changes in the fed funds rate cause a lock-step change in the prime rate. The spread between the prime rate and fed funds rate has been locked in at approximately 3%. Changes in the fed funds rate will cause a corresponding change to the prime rate, and changes to the prime rate will affect the interest rate charged on a variety of bank loans to individuals and businesses. The prime rate serves as a base rate for the interest rate on credit card debt. Similar to the pattern of changes in the prime rate mirroring changes in the fed funds rate, changes in the commercial bank rate on credit card plans also mirror changes in the fed funds rate.
Although changes in the fed funds rate generally ripple through to changes in mortgage rates, other factors affect mortgage rates, such as the demand for loans by home buyers, home prices, inflationary expectations, and available funds by financial institutions. As a result, the magnitude of change in the federal funds rate is typically different from the magnitude of change in mortgage rates. Although changes to the fed funds rate have generally moved mortgage rates in the same direction, exceptions have occurred due to other factors influencing mortgage rates.
Changes in the fed funds rate generally affect short-term and long-term bonds differently. Additional factors other than changes in the federal funds rate affect bond yields, including the demand for a given type of bond, the supply of bonds offered by issuers, inflationary expectations, and the default risk of the bond. The 3-month Treasury Bill Yield generally mirrors the fed funds rate, with the spread between the 3-month Treasury Bill Yield and fed funds rate being negligible. Changes in the fed funds rate cause a lock-step change in the 3-Month Treasury Bill Yield. Although the trend in the 10-Year Treasury Bond Yield generally follows increases or decreases in the fed funds rate, the spread between the two rates varies, reflecting factors in addition to changes in the fed funds rate that affect 10-Year Treasury Bond Yields.
For further information:
- From the Federal Reserve:
- CME FedWatch Tool: CME Fed Funds Futures
- From Investopedia: The Prime Rate

Kevin Bahr is a professor emeritus of finance and chief analyst of the Center for Business and Economic Insight in the Sentry School of Business and Economics at the University of Wisconsin-Stevens Point.