As 2025 comes to an end, it’s a mixed bag for the U.S. economy. Tariffs played the central role in shaping U.S. economic policy in 2025, and the long-term impact of tariffs is yet to be realized. 2026 features much uncertainty surrounding tariffs, namely legal issues, tariff implementation, and economic effects. By historical standards, the unemployment rate remained relatively low, but the labor market softened and the unemployment rate increased. October job losses hit a 22-year high for the month of October. While the overall employment rate was relatively low, different sectors faced varying challenges, with the unemployment rate for young people approaching 10%.
Although consumer spending continued to drive economic growth, increases in consumer spending were significantly greater for higher income households relative to lower income households. An evolving “K-shaped” economy widened the income and wealth differential of upper- and lower-income households, and increased the importance of dissecting any overall economic number or policy. The softening labor market and impact of tariffs raises the uncertainty for consumer spending in 2026. The record long government shutdown that began in October adversely impacted consumer spending and placed additional stresses on a variety of groups, particularly lower-income households and federal workers.
Driven by AI, the U.S. stock market continued to roll along and hit record highs, despite economic uncertainties. However, in a significant contrast with previous years, many foreign stock markets outperformed the U.S. market. The softening labor market spurred the Federal Reserve to cut interest rates, despite an uptick in inflation and the long-run uncertainty of the impact of tariffs on prices.
2026 brings economic uncertainty unlike no other year. The Supreme Court will make a decision on the legality of tariffs in 2026, raising the uncertainty over tariff policies and their economic effects. 2026 will also likely bring a greater influence over monetary policy by the Trump Administration with the end of Jerome Powell’s term as Fed Chair and changing fiscal programs. In addition to the uncertainties regarding consumer spending, the labor market, and economic growth, 2026 will likely feature the continued evolvement of the K-shaped economy.
Tariffs and Trade
Tariffs dominated the U.S. economic landscape in 2025. A tariff is basically a tax paid by a business to the U.S. government for importing goods from a foreign country. Tariffs are paid by the business importing the goods, not the foreign country sending the goods to the United States. Tariffs are a regressive tax, hitting lower and middle-income Americans to a greater degree than wealthier Americans, as lower and middle-income Americans spend a greater share of income on goods and buy relatively lower cost, imported goods to a greater degree. Tariffs typically lead to higher retail prices as importers try to pass on (at least some of) their higher costs onto consumers. Tariffs represent an increase in the government regulation of international trade and impact financial markets. In 2024, U.S. imports and exports of goods totaled approximately $3.3 trillion and $2.1 trillion, respectively. With the U.S. population at approximately 340 million, import product demand was nearly $10,000 per U.S. resident.
Prior to 2025, global tariff rates were relatively low since early this century. The weighted mean tariff rate has generally been below 5% for most countries since 2010. A brief spike in the U.S. rate occurred in 2019 due to Trump Administration initiated tariffs, but trade wars rescinded in 2020 and tariff rates declined. The U.S. mean tariff rate had spiked to 13.8% in 2019 but declined to 1.5% in 2020. The era of relatively low tariffs changed in 2025, when the United States increased tariff rates on imports from trading partners primarily based on U.S. trade deficits.
The parade of U.S. implemented tariffs began in February when President Trump signed an executive order targeting Canada, Mexico, and China. On April 2, the Trump Administration announced a minimum 10% global tariff rate, with country specific tariff rates ranging from 10% to approximately 50%. Although the Trump Administration referred to the new tariffs as “reciprocal”, the rates were not based on the tariff rates charged on U.S. imports by a given country. Rather, the “reciprocal” tariff rates were based on a mathematical formula related to the U.S. trade deficit with a given country. The greater the trade deficit with a given country relative to imports from that country, the greater the “reciprocal” tariff rate. The tariff formula used by the Trump Administration focused on merchandise trade deficits and did not take into account international trade in services, investments, or the size of a country’s economy.
The reciprocal tariff rates announced by the U.S. on April 2 were just the beginning of a roller coaster ride of tariff rate revisions. On April 9, the Trump administration announced a 90-day pause from the “reciprocal” tariffs announced on April 2, although the global tariff rate of 10% remained in effect. August 1 became the deadline (later extended to August 7) for countries to negotiate trade deals with the U.S., or face the reimplementation of the “reciprocal” tariffs. The 25% tariff rate (with certain product exceptions) was paused for Canada and Mexico on products covered by the USMCA. The tariff and trade war escalated with China, and by the end of April the U.S. had a 145% reciprocal tariff rate on goods imported from China (with certain product exceptions) with China having a reciprocal rate of 125% on U.S. goods. Negotiations led to the reciprocal tariff on China being lowered to 10% for 90 days on May 12; additional tariffs (justified by fentanyl and China’s unfair trade practices) applied to bring an effective rate of 30-55% for most products. In October, the fentanyl tariff on China was reduced from 20% to 10% and the 10% reciprocal tariff extended for one-year.
With an August deadline of U.S. tariffs reverting to the April 2 “reciprocal” rates unless trade deals were reached, multiple trade deals were finalized by the deadline. The focus of the Trump Administration on trade has been an implicit objective of reducing or eliminating trade deficits with trading partners, with an added goal of increasing manufacturing jobs. The United States has the largest economy in the world and dwarfs the economies of many of its trading partners. Given the size disparity of economies, U.S. trade deficits are not surprising, given the ability of the United States to afford more goods.
The Trump Administration has imposed tariffs based on the International Emergency Economic Powers Act (IEEPA), Section 232 of the Trade Expansion Act of 1962, and Section 301 of the Trade Act of 1974. The IEEPA gives the president the authority to regulate economic transactions following a declaration of a national emergency. The Trump Administration became the first presidential administration to invoke tariffs based on the IEEPA. The “reciprocal tariffs” are based on the IEEPA, as are the “fentanyl” tariffs on Canada, China, and Mexico. A minimum baseline (reciprocal) tariff rate of 10% has been imposed on all countries. Section 232 of the Trade Expansion Act of 1962 allows the U.S. government to impose tariffs on imports that threaten national security. Section 301 of the Trade Act of 1974 allows the U.S. government to place tariffs on goods from countries that are deemed to be engaging in unfair trade practices. Tariff rates may be “stacked” for a particular country, with the sum of multiple tariff rates determining the overall tariff rate.
Through July, the tariff taxes generated $122 billion in tax revenue in 2025 for the federal government. This compares to total individual income tax revenue of $2.4 trillion in 2024. The regulatory costs of administering the tariff program, including the regulatory costs to the U.S, government of enforcing the tariffs and the regulatory costs to businesses for complying with tariff laws, have not been disclosed.
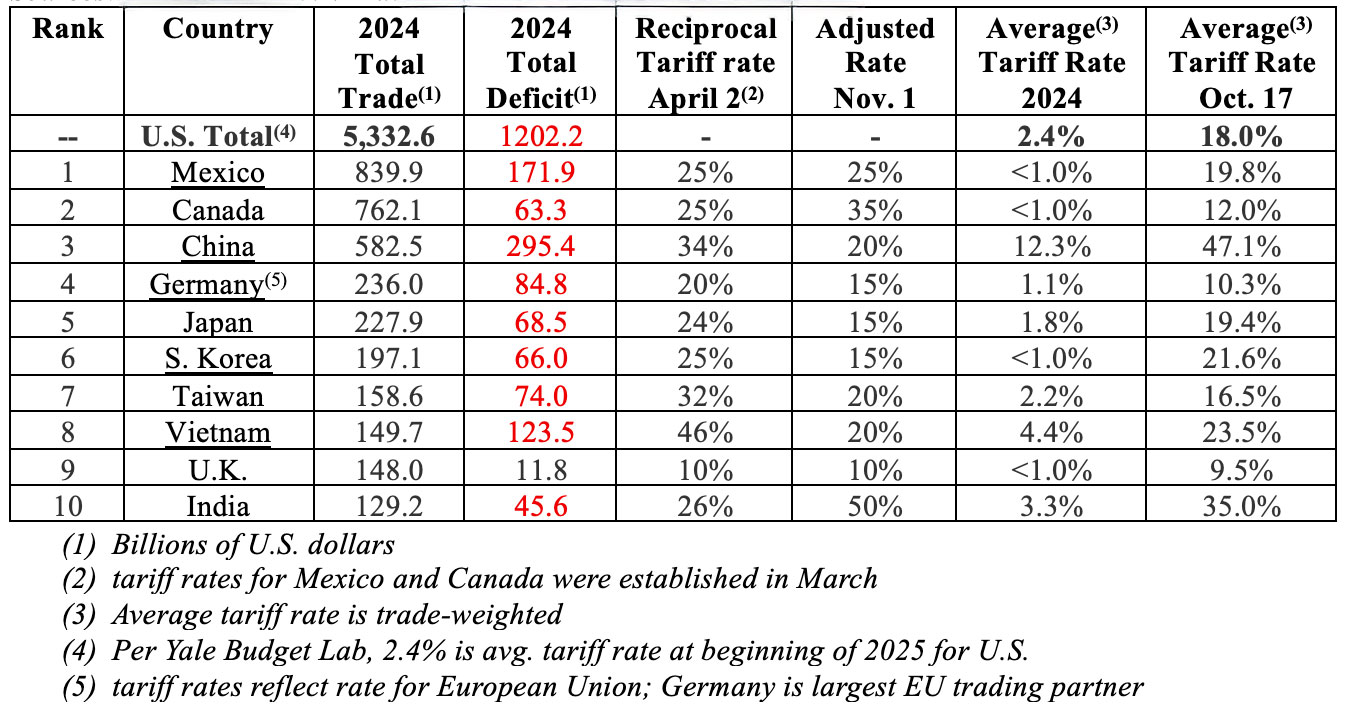
The table below contains information for the top ten U.S. trading partners, including total trade, the trade deficit, the “reciprocal” tariff rates announced April 2, the adjusted reciprocal tariff rates as of November 1, the 2024 trade-weighted average tariff rate, and the trade-weighted average tariff rate as of October 17. Reciprocal tariffs include the fentanyl tariff for Canada, Mexico, and China. The adjusted reciprocal tariff rate reflects any trade agreement or tariff rate adjustment made after April 2. The trade-weighted average tariff rate can differ from the reciprocal tariff rate because of additional layers of tariffs, including Section 232 tariffs (national security) and section 301 tariffs (unfair trade). The trade-weighted average tariff rate can also differ from the adjusted reciprocal tariff rate because of products excluded from tariffs, such as products covered in the USMCA. The United Nations Trade and Development has calculated the trade-weighted average tariff rate applied to each country based on the composition of exports to the U.S. in 2024.
2024 Top Ten U.S. Trading Partners in Goods
Specific product tariffs (section 232 and section 301 tariffs) include the following:
- 50% tariff on steel and aluminum imports; 25% for U.K.
- 50% tariff on copper imports
- 25% tariff on all automobiles, with an exemption for U.S. content and a discount through April 2027 on parts tariffs for U.S.-assembled autos; reduced to 10% on the first 100,000 U.K. imports; reduced to 15% for Japan, E.U. and South Korea
- 25% tariff on Medium/heavy-duty trucks and key parts
- 10% tariff on buses; lumber; Canadian potash and energy
- 25% for kitchen cabinets and vanities (50% in 2026) and upholstered wooden furniture (30% in 2026)
A summary of the trade deals and tariffs for America’s top trading partners, listed in order by 2024 U.S. total trade in goods, is shown below. It should be noted that some of the details regarding the trade deals are yet to be determined, and there are certain product exemptions for any specific tariff. Although certain trade deals have been made, any trade deal is in effect only as long as both countries want it to be.
- Mexico – Mexico and the U.S. agreed to extend an existing trade deal as talks continue to reach a new trade deal. The U.S. extended its 25% tariff on Mexico, excluding goods covered by the USMCA.
- Canada – As a result of failed trade talks, the U.S. implemented a 35% tariff in August on goods not covered by the USMCA, up from the previous 25% tariff rate that was in effect. Another 10% tariff was added in October by the Trump Administration in response to an advertisement by the Province of Ontario that featured President Ronald Reagan criticizing tariffs.
- China – In October, following trade talks, the U.S. announced it would reduce the “fentanyl” tariff on China from 20% to 10%, and extend the 10% base reciprocal rate for one year.
- Germany – A new trade deal with the European Union includes a blanket tariff rate of 15% on all goods imported from the E.U., and an agreement by the E.U. to purchase $750 billion of American energy and increase investment in the U.S. by more than $600 billion.
- Japan – A new trade deal includes a 15% tariff rate on goods imported from Japan, and a commitment by Japan to invest $550 billion in the U.S.
- South Korea – A new trade deal includes a 15% tariff rate and pledge to invest $350 billion in the U.S.
- Taiwan – The U.S. imposed a 20% tariff in August on most goods from Taiwan, with further trade talks expected.
- Vietnam – A new trade deal with Vietnam includes a 20% tariff rate on goods imported from Vietnam and 40% on goods transshipped (goods from other countries shipped through Vietnam to the U.S.). Certain goods were exempt from the tariff.
- United Kingdom – A new trade deal includes a tariff rate of 10% on goods imported from the U.K. The 10% tariff rate on vehicles imported from the U.K. only applies to a quota of 100,000 vehicles a year, which is approximately the number of cars currently sold into the U.S. Vehicles exceeding the quota face a 25% tariff. U.K. steel exported to the U.S. is subject to a 25% tariff, which is lower than the 50% global rate.
- India – No new trade deal as of August deadline, resulting in the U.S. implementing an additional 25% tariff rate on August 27 on top of the existing 25% tariff rate. The resulting 50% tariff rate was the highest rate of any top trading partner. A new trade deal is expected soon.
The Yale Budget Lab estimated an overall average effective tariff rate of 17.9% for tariff policies in effect as of October 31, the highest since 1934.
The tariff landscape changed frequently in 2025 and may change again in 2026. Legal challenges to tariffs have made their way to the Supreme Court with a decision expected in 2026. However, it is likely that tariffs will remain in effect to at least some degree. The economic effects of changes in U.S. tariff and trade policy will take years to discern, as U.S. corporations will have to consider the new and changing trade landscape into long-term strategic and financial decisions, including product sourcing, cost structure, product pricing, product mix, business investment, and changes in export and import markets. While tariffs can be implemented quickly, strategic and financial planning by U.S. and foreign businesses is a long-term process. The ultimate questions are how tariffs will impact costs to businesses, prices to consumers, U.S. economic growth, the labor market, changes in international trade, sourcing decisions by U.S. businesses, and U.S. economic leadership.
Inflation
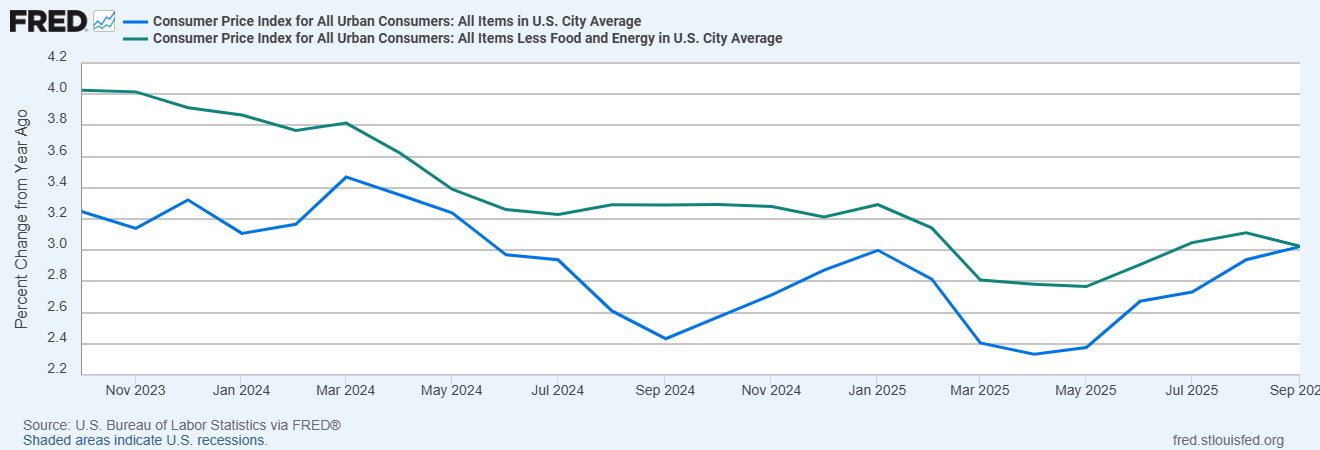
The graph below shows the annualized U.S. inflation rate for the 3-year period ending October 2025, as measured by the 12-month change in the Consumer Price Index (CPI) for all items (blue line) and the Consumer Price Index, less Food and Energy (green line). Stripping out the relatively volatile categories of food and energy from the Consumer Price Index provides a measure of core inflation. Although Americans may have been hoping for price declines in 2025, particularly in food, that hasn’t happened. Inflation trended downward as 2025 began, decreasing from 3.0% in January to 2.3% in April, but steadily increased back to 3.0% in September, the highest rate of inflation since January. Core inflation, measured by stripping out the relatively volatile food and energy categories from the CPI all items index, matched the overall inflation rate of 3.0% in September. Core inflation had generally declined from a 4.0% rate in October 2023 before bottoming out at 2.8% in May 2025. More importantly, inflation kicked up significantly in recent months over several categories.
Percent Change in CPI and CPI Less Food and Energy from One Year Ago
October 2023 – September 2025
Listed below is the one-month price change for August and September for selected expenditure categories, as well as the price change for the 12-months ended September 2025.
CPI by Expenditure Category, August and Sept. 2025 One-Month (seasonally adj.) Changes;
12-month Change for Period Ending September 2025
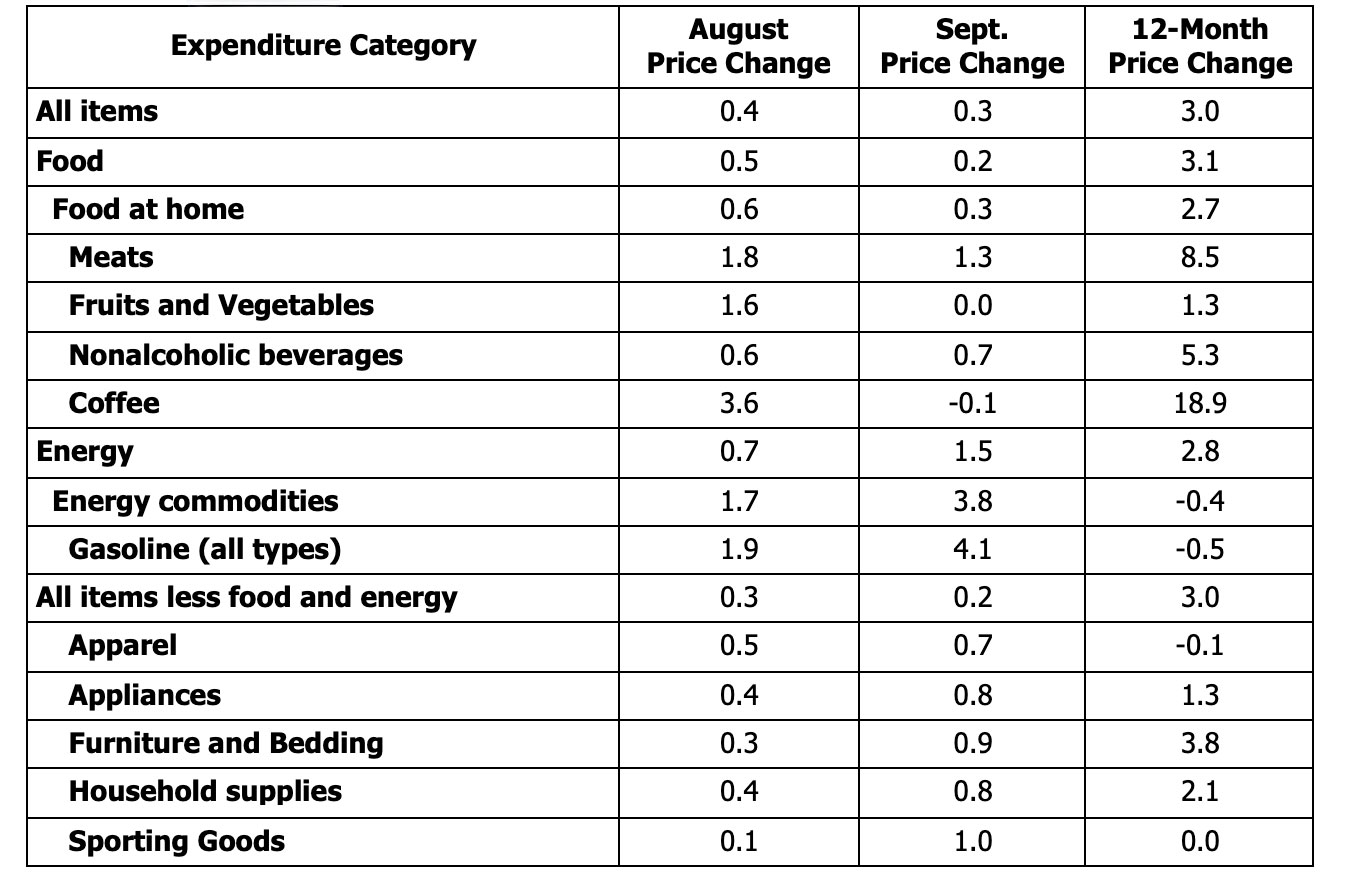
For the 12-months ended September, consumers were stressed by sharp increases in several food products. Overall meat prices were up 8.5%, with beef and veal prices climbing 14.7%. Other price increases included coffee skyrocketing 18.9%, while apples and bananas were up 5.3% and 6.9%, respectively. Fresh vegetables were up 2.8%, while canned fruits and vegetables climbed 5.0%. In just the two-month period of August and September, overall food at home rose nearly 1% with meats, fruits and vegetables, nonalcoholic beverages, and coffee having price increases over 1.0%. Apparel, appliances, furniture and bedding, household supplies, and sporting goods also had price increases greater that 1.0% over the two-month period of August and September. Energy prices rose sharply, increasing over 2%.
One of the big questions is the extent to which tariffs will impact inflation. A variety of studies have indicated that although tariffs have recently impacted prices, the ultimate effect is yet to be determined.
A study by the Federal Reserve Bank of St. Louis found that tariffs have accounted for a sizable share of recent inflation. Recently imposed tariffs added 0.5 percentage points to inflation from June through August. The St. Louis Fed study notes that tariffs, as of yet, have not driven up consumer prices as sharply as initially predicted. Their research indicated that many businesses are waiting to see where tariff rates settle before they adjust their prices.
Tariffs can have direct and indirect effects on consumer prices. The direct impact of tariffs includes the price increase of the import price itself. The indirect impact of tariffs on prices includes the substitution of domestically available products for imports. The domestically available products have become more price competitive due to the tariffs on imports, but still raise the prices of products to consumers. The indirect impact of tariffs on price levels will likely be smaller than the tariff increase.
Research by The Pricing Lab at the Harvard Business School Digital Data Design Institute tracked retail prices using real-time barcode data on a variety of products. Data through early October showed that tariffs have raised retail prices on average by about 4.9 percentage points relative to the pre-tariff trend, including a 6.0 percentage point increase for imported goods and a 4.3 percentage point rise for domestic goods. Large price increases were noted for several products, including apparel (8.99 percentage points), coffee and tea (7.5 percentage points), cameras (7.5 percentage points), household textiles (6.2 percentage points), and furniture (6.5 percentage points).
The Yale Budget Lab estimated that the tariff policies in effect as of October 31 will increase prices by 1.3% in the short run, representing an annual loss of $1,800 for the average household and $1,000 for households in the bottom decile of the income distribution. As a percentage of income, the annual loss due to tariffs is greatest for households in the lowest decile of household income and least for households in the top decile of household income. Tariffs contribute to the K-shaped economy. Product prices most adversely impacted by the 2025 tariffs include apparel, products with high metal content like electrical equipment and computers, and motor vehicles. The tariffs will also negatively impact economic growth and employment.
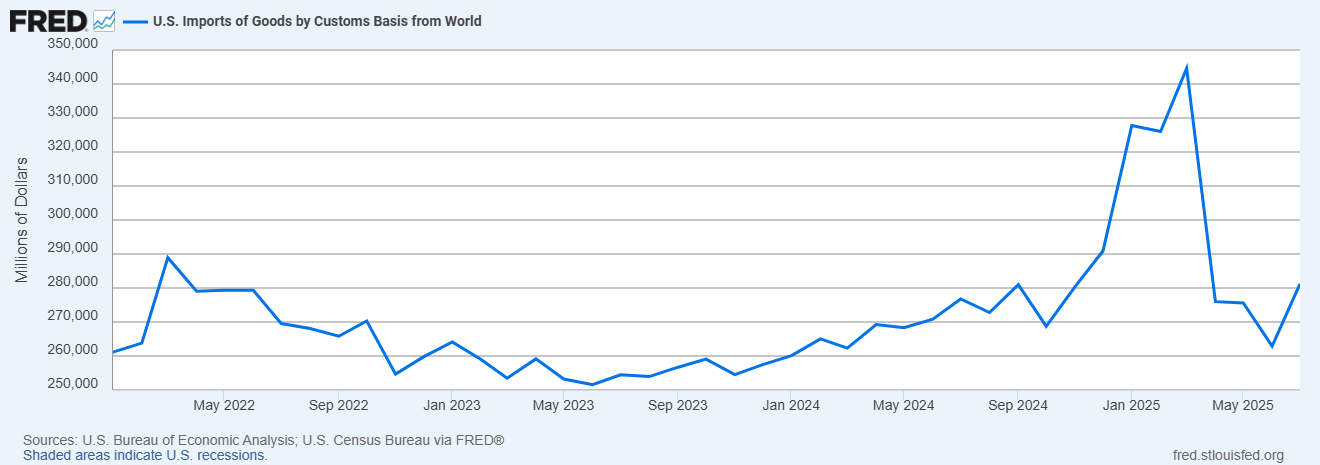
Future price increases may also be impacted by import trends. The chart below shows U.S. imports of goods over the period from January 2022 through July 2025. After peaking at $289 billion in March 2022, imports steadily declined before bottoming out at $252 billion in June 2023. A steady rise brought imports to $281 billion in September 2024. In 2025, U.S. companies front-loaded imports and inventory prior to the pending April reciprocal tariffs. A record $345 billion of imports (seasonally adjusted) were recorded in March 2025, up nearly 25% from the $280 billion in November 2024. Imports dropped to $263 billion in June before increasing in July. The questions become:
- How long will it take companies to work through pre-tariff inventory?
- How will costs to businesses and prices to consumers be impacted when pre-tariff inventory is gone?
U.S. Imports of Goods, January 2022 – July 2025
While the initial impacts of tariffs have rippled through the economy, the ultimate effect of tariffs on consumer prices, costs to businesses, the labor market, and economic growth, remains to be seen.
The Labor Market
The U.S. unemployment rate increased to 4.3% in August, up from 4.0% at the start of the year. The labor market was softening and different worker groups faced varying challenges in the current job market. In 2025, those challenges have increased, with unemployment rates increasing for most worker groups. In October, according to outplacement firm Challenger, Gray & Christmas, employers cut 153,074 jobs, which was the worst October the economy has seen since 2003. Tech companies led the way in job cuts, and major employers that announced workforce reductions included Microsoft, Amazon, and UPS.
Labor Market Trends – Young Men and Young Women
The graph below shows the overall unemployment rate (red line), the unemployment rate of young men aged 20-24 years (blue line), and the unemployment rate of young women aged 20-24 years (green line) between January 2019 and August 2025.
Unemployment Rate: Overall, Young Men aged 20-24 yrs., Young Women aged 20-24 yrs.
January 2019 – August 2025
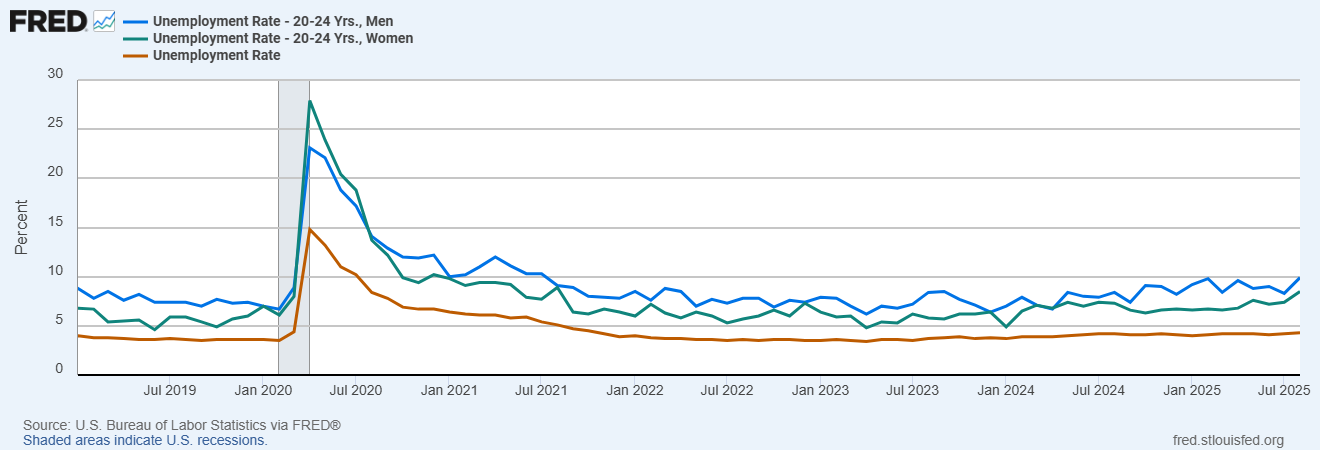
In 2025 the unemployment rate for young people (aged 20-24 years), both men and women, rose significantly. In August, the unemployment rate of young men was 9.9%, jumping from the December 2024 unemployment rate of 8.2%. The August unemployment rate for young men was the highest since July 2021. In August, the unemployment rate of young women was 8.5%, increasing from the December 2024 unemployment rate of 6.7%. The August unemployment rate for young women was the highest since August 2021. Part of the reason that young women have fared better than young men in the job market is recent industry hiring. For the 12 months ended August 2025, private education and health services, occupations typically dominated by women, led the hiring with an increase of 862,000 jobs. Leisure and hospitality ranked second with an increase of 232,000 jobs followed by government which added 138,000 jobs. Manufacturing led job losses with 78,000.
Labor Market Trends – College and High School Graduates
The graph below compares unemployment rates for three different worker groups: 1) Recent college graduates, workers aged 25 to 34 with a bachelor’s degree (blue line), 2) High school graduates, defined as workers aged 25 and over with no college (green line), and 3) All college graduates, workers aged 25 years and over with a bachelor’s degree (red line).
Unemployment Rates for College and High School Graduates, aged 25+ Years
January 2019 – August 2025
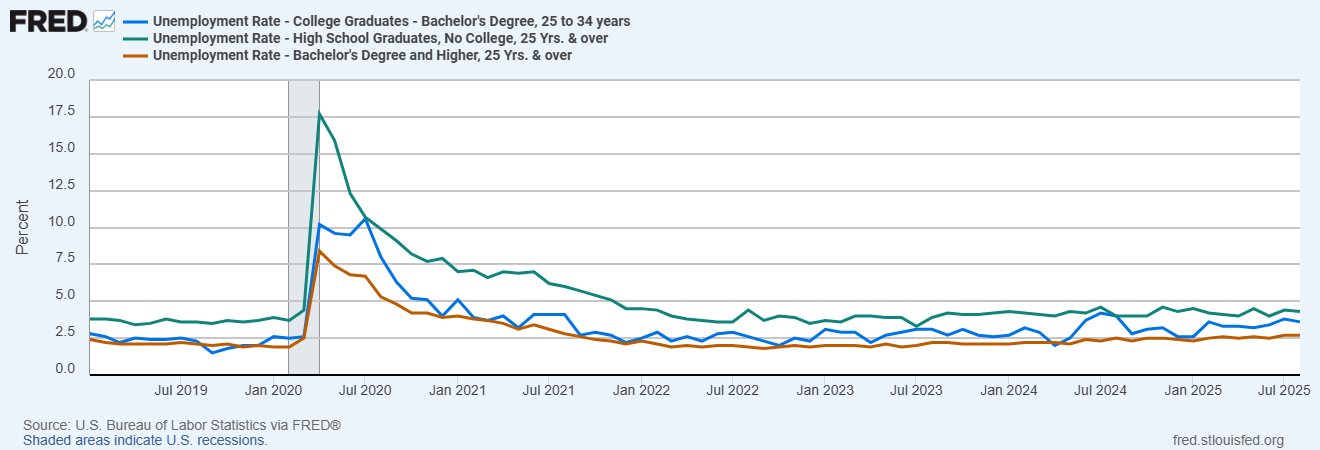
Relative to December 2019, the August 2025 unemployment rate was up for all groups. The unemployment rate for high school workers (no college degree) increased from 3.7% to 4.3%, while the unemployment rate for recent college graduates rose from 2.0% to 3.6% and all college graduates from 2.0% to 2.7%. Beginning in 2019, the unemployment rate for recent college graduates has generally been higher than the unemployment rate for all college graduates. On a relative basis, it has been getting harder for recent college graduates to find a job, however the unemployment rate of recent college graduates has remained consistently lower than the unemployment rate for high school workers. Although it has been getting more difficult for recent college graduates to find a job, earnings still remain correlated to educational attainment.
Consumer Spending
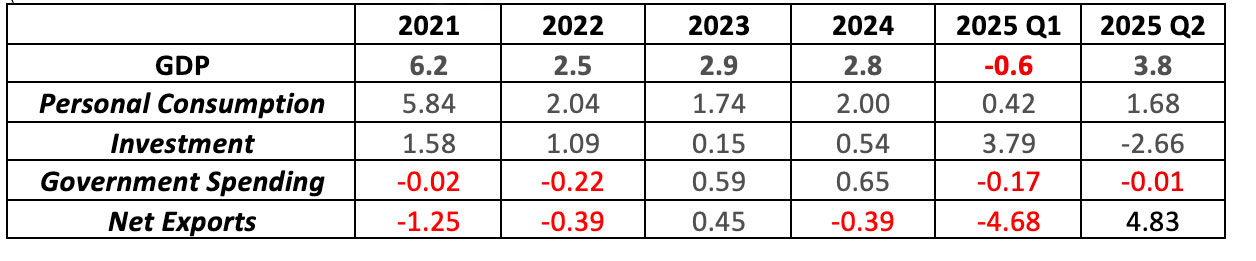
Personal consumption accounts for approximately two-thirds of Gross Domestic Product, and personal consumption has been the key and consistent driver of economic growth since 2021.
The table below shows how changes in the four components of Gross Domestic Product (GDP) contributed to the change in U.S. economic growth since 2021. Economic growth is measured by changes in GDP, which is the value of goods and services produced in a given time period. As indicated in the chart below, personal consumption generally contributed significantly more to GDP growth than investment spending (including business investment in equipment and inventories), government spending, or net exports. An exception occurred in the first quarter of 2025, as business investment increased significantly due to the pre-tariff inventory build-up.
Contributions to Percent Change in Real Gross Domestic Product–Annualized Rate
According to research by the Bank of America Institute – Consumer Checkpoint (based on Bank of America customer data), consumer spending remained strong in September 2025. Total credit and debit card spending per household increased 2.0% year-over-year from September 2024. The September increase follows a year-over-year gain of 1.7% in August. However, although overall consumer spending increased, there was a significant difference in consumer spending by income level. Growth in consumer spending was significantly less for lower-income households relative to middle and higher-income households. In September, year-over-year wage growth was 4% for higher-income households while for lower-income households rose only 1.4%. Stronger wage growth, combined with the increased wealth effects from a rising stock market, contributed to a K-shaped economy and greater consumer spending growth for middle and higher-income households relative to lower income households.
Stock Market
The stock market reflects expectations for future economic performance and corporate profitability. The U.S. stock market shrugged off tariff uncertainty and rose to record highs in 2025. However, in a major shift for stock market performance, the U.S. stock market lagged behind most major foreign stock markets.
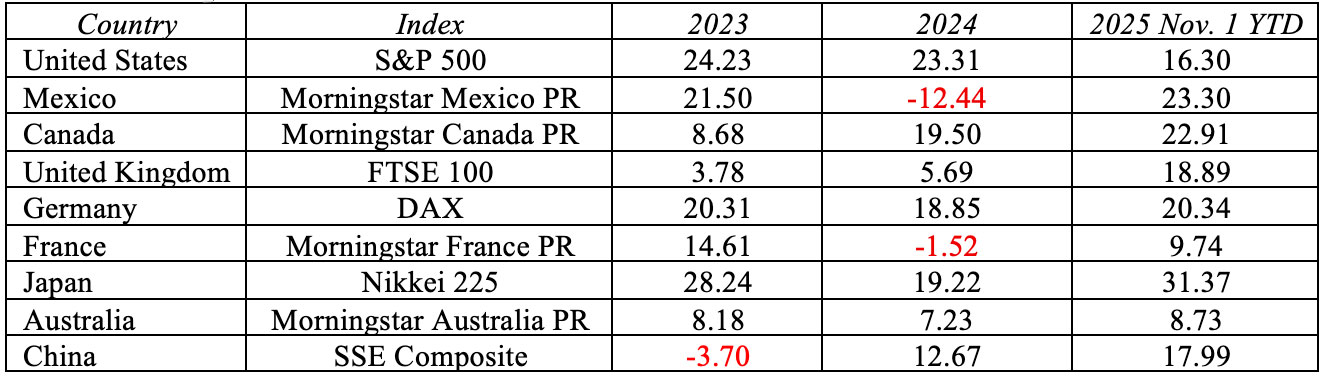
The table below compares major stock index returns for selected countries for 2023, 2024, and year-to-date through November 1, 2025. The selected indexes are broad measures of stock market performance in their respective countries. The U.S. S&P 500 is a leading benchmark index for U.S. large company (large-cap) stocks, with a long-run historical annual average return of approximately 10%. The U.S. stock market soared in 2023 and 2024, with returns more than twice the historical average. In 2024, the U.S. stock market was the leader of the pack, with the S&P 500 returning 23.31%, slightly lower than the 2023 return of 24.23%. Year-to-date through November 1 the U.S. S&P 500 returned 16.30%, significantly higher than the historical average, but lower than several foreign stock market returns. Despite the U.S. imposed tariffs in 2025, the stock market performance of Mexico, Canada, the United Kingdom, Germany, Japan, and China exceeded the performance of the S&P 500 through November 1.
Artificial intelligence has been a key driver of stock market performance. The Morningstar Global Artificial Intelligence Select Index includes stocks of 48 major companies with exposure to generative AI, AI data & infrastructure, AI software, and AI services. The index rose 75.27% and 34.78% in 2023 and 2024, respectively, with another 38.58% increase year-to-date through November 1. Five stocks with significant AI exposure comprise over 25% of S&P 500 market capitalization (total stock value): 1) Apple, 2) Nvidia, 3) Microsoft, 4) Alphabet, and 5) Amazon.
Global Stock Market Performance of Selected Indexes
Year-to-Date and Five-Year Returns (annualized) as of November 1, 2025
Interest Rates and the Federal Reserve
The Federal Reserve is the key driver of short-term interest rates in the United States economy through its monetary policy, which is implemented primarily through targeting the federal (fed) funds rate. The fed funds rate is the overnight borrowing rate between banks, a very short-term interest rate that when changed, typically has a rippling effect throughout financial markets. Changes in the fed funds rate generally affect savings and borrowing rates, although the Federal Reserve’s monetary policy is not the only factor that influences savings and borrowing rates.
The Federal Reserve influences the fed funds rate primarily by controlling the money supply in the United States. The amount of money circulating in the economy has an impact on interest rates and credit conditions – more money, lower interest rates; less money, higher interest rates. The fed funds rate is increased when the Federal Reserve decreases the money supply by selling Treasury securities (technically called Open Market Operations). The fed funds rate is decreased when the Federal Reserve increases the money supply by buying Treasury securities. Generally, the fed funds rate is lowered to increase economic growth and consequently employment, and raised to reduce inflationary pressures.
The Federal Reserve sets the target for the fed funds rate at a level consistent with its dual mandate of achieving maximum employment and price stability. 2025 has been a challenging year for the Federal Reserve, as the uncertainties of the impact of tariffs on inflation contrasted with a softening labor market created a dichotomy for the direction of Federal Reserve policy. In September, in response to the softening labor market, the Federal Reserve implemented its first rate cut of the year, lowering the fed funds rate by 25 basis points to a target range of 4.00-4.25. Another 25-basis point cut occurred in late October, lowering the fed funds target range to 3.75-4.00. The CME FedWatch Tool provides insight as to what the financial markets expect for interest rates based on fed funds futures pricing. As of mid-November, the financial markets anticipated another rate cut when the Federal Reserve Open Market Committee meets in December, but the Federal Reserve has indicated another rate cut is not a foregone conclusion. Ultimately, the Federal Reserve will balance the dichotomy of a softening labor market with increased tariff inflation when setting the fed funds rate at a level consistent with its dual mandate.
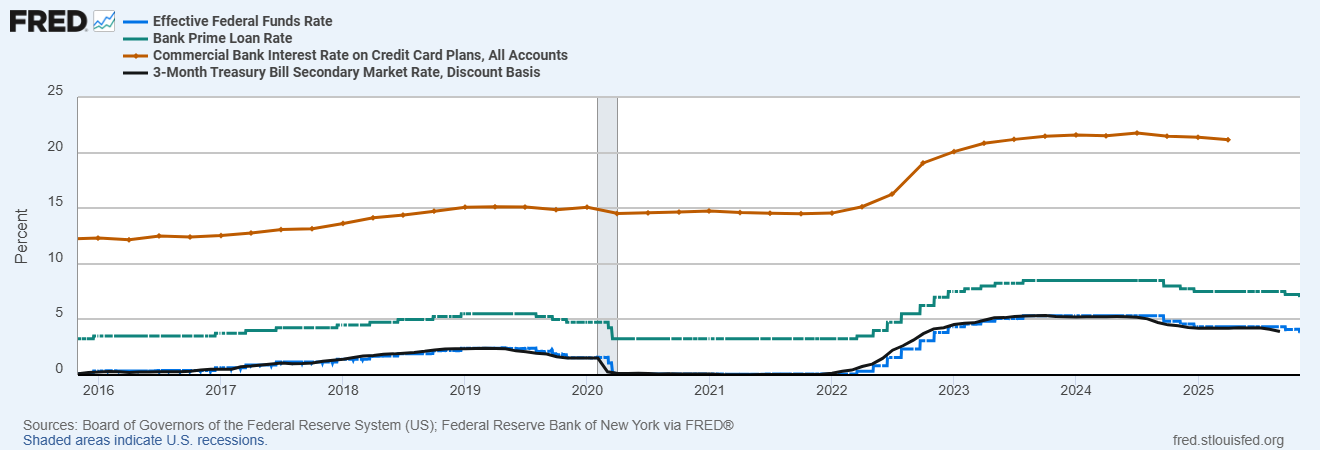
Changes in the fed funds rate have a rippling effect through financial markets, particularly short-term interest rates. The graph below shows the relationship between the effective federal funds rate (blue line) and three short-term interest rates: the bank prime rate (green line), the commercial bank rate on credit card plans (orange line) and the 3-Month Treasury Bill Yield (black line) from October 2016 through October 2025. The prime rate is the interest rate that U.S. commercial banks charge their most creditworthy customers for loans. The rate serves as a base rate for various types of loans, including personal loans, small business loans, and credit cards. Treasury bills are short-term securities with maturities ranging from 4 to 52 weeks and are used to help the federal government finance budget deficits.
Changes in the fed funds rate cause a lock-step change in the prime rate, with the spread between the prime rate and fed funds rate locked in at approximately 3%. Similar to the pattern of changes in the prime rate mirroring changes in the fed funds rate, changes in the commercial bank rate on credit card plans also mirror changes in the fed funds rate. The trends between the three rates are closely related, reflecting that the prime rate serves as a base rate for the interest rate on credit card debt. The commercial bank interest rate on credit card plans is greater than the prime rate, which is greater than the federal funds rate. Changes in the fed funds rate also cause a lock-step change in the 3-Month Treasury Bill Yield. The spread between the two rates has hovered around zero over the past ten years. Changes to the fed funds rate will generally cause a lock-step change to the prime rate, the commercial bank interest rate on credit cards, and Treasury Bill yields.
Effective Federal Funds Rate, Bank Prime Loan Rate, Commercial Bank Interest Rate on Credit Card Plans, and 3-Month Treasury Bill Yield
October 2016 – October 2025
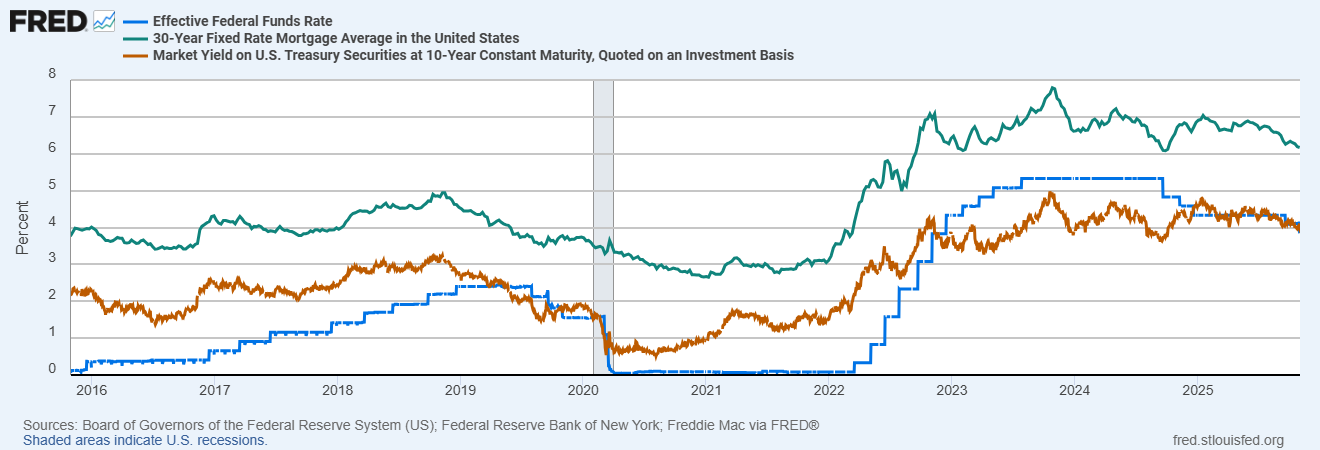
The graph below shows the relationship between the effective federal funds rate (blue line) and two long-term interest rates: the 30-year fixed rate mortgage average in the United States (green line) and the 10-year Treasury Bond Yield (orange line). Although changes in the fed funds rate generally ripple through to changes in long-term interest rates in some degree, there is generally not a lock-step relationship between changes in the fed funds rate and long-term interest rates. Specific factors in addition to the fed funds rate affect long-term interest rates in financial markets. Other factors that affect mortgage rates include the demand for loans by home buyers, home prices, inflationary expectations, and available funds by financial institutions. As a result, the magnitude of change in the federal funds rate is typically different from the magnitude of change in mortgage rates. Although changes to the fed funds rate have generally moved mortgage rates in the same direction, exceptions have occurred due to other factors influencing mortgage rates.
Treasury bonds are long-term financial securities that are also used to help the federal government fund budget deficits. Contrary to the relatively constant spread between the federal funds rate and 3-Month Treasury Bill Yield, the spread between the federal funds rate and 10-Year Bond Yield varies. Different factors affect the rates, particularly the impact of inflation and the specific demand and supply of the bonds.
Effective Federal Funds Rate, 30-Year Fixed Rate Mortgage, and 10-Year Treasury Bond Yield
October 2016 – October 2025
Federal Reserve policy in 2026 and interest rate changes are subject to much uncertainty. Further interest rate changes will be a function of inflation and labor market strength resulting from economic growth. The Federal Reserve strives to act in a nonpartisan, independent manner to implement policies for the long-term benefit of the U.S. economy. Ultimately, providing the Federal Reserve maintains its independence, policy and interest rate decisions will be guided by their dual policy mandate of achieving maximum employment and price stability. The current chairman, Jerome Powell, began serving his first term in 2018 after being nominated by President Trump and confirmed by the Senate. He received a subsequent term after being nominated by President Biden and confirmed by the Senate in 2022. Chairman Powell’s term expires in May 2026. Given the pending chairman change in 2026, the influence of the executive branch on monetary policy and autonomy of the Federal Reserve remains to be seen.
Summary
2025 was quite a year for the United States economy, with tariffs being the key driver in the Trump Administration’s economic policy. 2025 was the kick-off for tariffs, but in 2026 the long-term effects may begin to be realized with continued economic and legal uncertainty arising from volatile tariff policies. Several economic factors contributed to an evolving K-economy, with an increasing differential between the income and wealth of upper- and lower-income households. That trend is likely to continue in 2026.
The United States economy had mixed results in 2025. By historical standards, the unemployment rate remained relatively low, but the labor market softened and the unemployment rate increased. October job losses hit a 22-year October high. The job market for young people was particularly difficult, with the unemployment rate approaching 10%. The softening labor market and impact of tariffs raises the uncertainty for consumer spending in 2026. Although consumer spending continued to drive economic growth in 2025, growth in consumer spending was significantly greater for higher income households relative to lower income households. Housing prices have moderated, but home affordability remains difficult for many American households. Although it lagged the performance of several foreign stock markets, the U.S. stock market reached record highs in 2025, shrugging off economic concerns. The stock market was spurred by AI stocks, but relatively high valuations add to uncertainties for 2026. The softening labor market spurred the Federal Reserve to cut interest rates, despite an uptick in inflation and the long-run uncertainty of the impact of tariffs on prices.
Tariffs, inflation, consumer spending, the stock market, and Federal Reserve policy always contain some measure of uncertainty, but that uncertainty ramps up significantly in 2026.
For further information:
- From the Budget Lab at Yale University: Trade and Tariffs
- From the Peterson Institute for International Economics:
- From China Briefing: Breaking Down the US-China Trade Tariffs: What’s in Effect Now?
- From Avalara: The Difference Between Tariffs
- From Reed Smith: Trump 2.0 tariff tracker | Trade Compliance Resource Hub
- From World Scorecard: US Tariffs and The World – Tariff Rates by Country (October 2025)
- From Tariff Check.org: Tariff Check – Current Tariffs by Country & Products
- From the U.N. Trade and Development: Tariff dashboard – tracking the evolution of US tariffs | UN Trade and Development (UNCTAD)
- From the U.S. Census Bureau and Bureau of Economic Analysis: U.S. International Trade
- From the U.S. Census Bureau:
- From Cole International: Section 232 tariffs in 2025
- Info from the Bureau of Labor Statistics:
- From the Harvard Business School Pricing Lab – Digital Data Design Institute: Tariff Tracker
- From the St. Louis Federal Reserve: How Tariffs are Affecting Prices
- Info from the Bureau of Labor Statistics:
- GDP Growth (and other national data) from the Bureau of Economic Analysis: GDP Growth
- From Bank of America: Consumer Spending Data & Trends – Consumer Checkpoint
- From Investopedia: S&P 500 Average Return and Historical Performance
- From Morningstar:
- From the Motley Fool: These 5 Artificial Intelligence (AI) Stocks Make Up 28.8% of the Entire S&P 500 Index
- From the Federal Reserve: Fed Funds Rate
- CME FedWatch Tool: CME Fed Funds Futures

Kevin Bahr is a professor emeritus of finance and chief analyst of the Center for Business and Economic Insight in the Sentry School of Business and Economics at the University of Wisconsin-Stevens Point.