
The U.S. stock market reflects expectations for future economic performance and corporate profitability. In 2025, the S&P 500, a broad benchmark index for U.S. large company (large-cap) stocks, rose to record highs. However, in a major shift for stock market performance, the U.S. stock market lagged behind most major foreign stock markets. This blog will review the performance of the U.S. stock market relative to foreign stock markets, stock market valuations, and the impact of U.S. stock market performance on the K-shaped economy.
U.S. Stock Market Performance
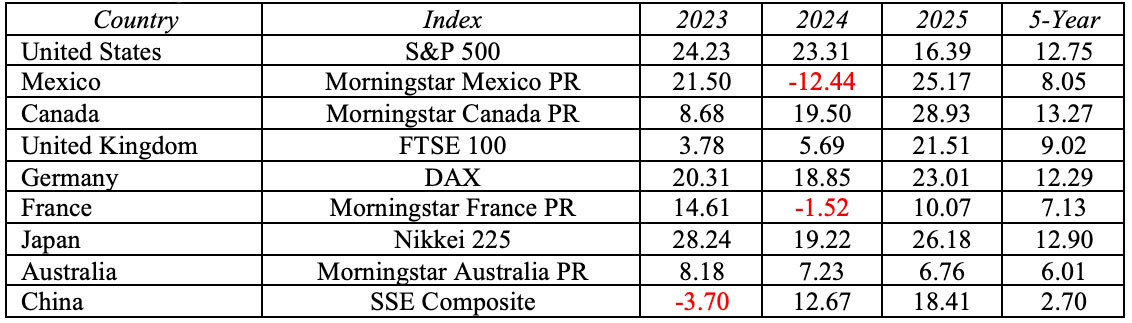
The table below compares major stock index returns for selected countries for 2023, 2024, 2025, and the 5-years (annualized) ending December 31, 2025. The selected indexes are broad measures of stock market performance in their respective countries. The U.S. S&P 500 is a leading benchmark index for U.S. large company (large-cap) stocks, with a long-run historical annual average return of approximately 10 percent. The U.S. stock market soared in 2023 and 2024, with returns more than twice the historical average. In 2024, the U.S. stock market was the leader of the pack, with the S&P 500 returning 23.31 percent, slightly lower than the 2023 return of 24.23 percent. In 2024 the U.S. outperformed every other index listed below.
That trend reversed in 2025. Although the S&P 500 reached record highs, the U.S. stock market lagged behind several foreign stock markets. In 2025 the U.S. S&P 500 returned 16.39 percent, significantly higher than the historical average, but lower than the returns of several foreign stock markets. Despite the U.S. imposed tariffs in 2025, the stock market performance of Mexico, Canada, the United Kingdom, Germany, Japan, and China exceeded the performance of the S&P 500. The stock markets of America’s top three trading partners – Mexico, Canada, and China, all outperformed the S&P 500 despite significant U.S. tariffs. Canada and Mexico vastly outperformed, with stock market returns of 28.93 percent and 25.17 percent, respectively, compared to the 16.39 percent for the U.S.
The 2025 Canadian stock market performance propelled it to the top spot for 5-year returns, with annualized returns of 13.27 percent. The U.S. finished third in 5-year returns, with annualized returns of 12.75 percent, slightly behind Japan’s 12.90 percent.
Global Stock Market Performance of Selected Indexes
2023, 2024, 2025 and Five-Year Returns (annualized) as of December 31, 2025
Artificial intelligence has been a key driver of stock market performance. The Morningstar Global Artificial Intelligence Select Index includes stocks of 48 major companies with exposure to generative AI, AI data & infrastructure, AI software, and AI services. The index rose 75.27 percent and 34.78 percent in 2023 and 2024, respectively, with another 30.84 percent increase in 2025. The Nasdaq Composite Index includes over 2,500 stocks and is a key indicator of tech sector stock market performance. Driven by AI, the Nasdaq was up 20.36 percent in 2025, following increases of 43.42 percent and 28.64 percent in 2023 and 2024, respectively. The S&P 500 also includes significant exposure to AI, with five tech-heavy stocks comprising over 25 percent of S&P 500 market capitalization (total stock value): 1) Apple, 2) Nvidia, 3) Microsoft, 4) Alphabet, and 5) Amazon.
Stock Market Valuation
Increasing stock valuations were a growing cause of consternation for financial markets in 2025. The price-to-earnings (P/E) ratio is one of the most popular stock valuation measures that compares a company’s stock price relative to its earnings. The P/E is defined as a company’s stock price divided by its earnings per share (EPS). The P/E ratio, also referred to as the price or earnings multiple, helps assess the value of a company’s stock relative to its earnings per share. The P/E ratio of an index, like the S&P 500, can provide a broad assessment of how the stock market is valued relative to corporate earnings. The S&P 500 P/E multiple (also called the market multiple) is calculated by dividing the index value by the total earnings per share for the trailing 12 months for the companies comprising the S&P 500.
If the market multiple (S&P 500 P/E) remains constant, an increase in corporate earnings per share will cause stock prices to increase. Conversely, a decrease in corporate earnings per share will cause stock prices to decrease. Changes in the market multiple can occur if there is a change in growth expectations for corporate earnings, or if there is a change in the risk and uncertainty for corporate earnings. If the growth rate of corporate earnings is expected to increase, then the market multiple will generally increase. The market multiple is positively related to earnings growth and negatively related to risk and uncertainty. If risk and uncertainty increase for corporate earnings, then the market multiple will generally decrease.
In 2025, the S&P 500 multiple expanded as AI fueled increased expectations for future corporate earnings growth. Excluding inflated market multiples due to depressed earnings during recessions in 2001, 2008, and 2020, the S&P 500 multiple ended 2025 approaching 31, its highest level since 1999. The S&P 500 multiple at the beginning of 2022, 2023, 2024, and 2025 was 23.11, 22.82, 25.01, and 28.16, respectively.
In the decade of the 1990s, it was the advent of the internet that fueled speculation over corporate earnings growth. The S&P 500 multiple grew from 19.53 at the beginning of 1997 to 34.00 in April 1999. However, speculation does not always transform into reality. Speculation and hype can lead to a misalignment between expectations and reality for corporate earnings. A divergence occurs between the market price of a stock and its true, intrinsic value. The speculation can create a fragile environment for stock prices if realized corporate earnings don’t match expected earnings.
The United States began the new century with a variety of bumps to the economy, which led to decreasing growth expectations and increasing uncertainty for corporate earnings. The dot.com bubble was over, with overhyped tech and internet stocks crashing back to reality as actual earnings fell short of expectations. The September 11, 2001 terrorist attacks contributed to an economic decline, as uncertainty and fear gripped the economy. In addition, the financial markets were plagued by accounting scandals (Enron). The technology heavy Nasdaq index declined nearly 70 percent between December 2000 and October 2002, while the S&P 500 dropped over 45 percent. Sagging expectations for earnings growth and economic uncertainty contributed to the S&P 500 multiple declining from 34.00 in April 1999 to 26.50 by October 2000.
If an expanding market multiple results from expectations for increased corporate earnings growth, the ultimate question is whether or not those expectations will match reality. They didn’t after the turn of the century. Time will tell if the 2025 market multiple increase was justified.
Stock Market Performance and the K-shaped Economy
Although good stock market performance benefits nearly all stock market investors, it also contributes to a growing K-shaped economy. The “K-shaped” economy refers to the expanding income and wealth differences of upper- and lower-income households.
Generally, stock ownership has increased in the United States. According to the most recent Federal Reserve Survey of Consumer Finances (2022), approximately 58 percent of U.S. families owned stock in 2022, either directly or indirectly (through mutual funds and pension plans), up from 53 percent in 2019. Participation in the stock market in 2022 rose with income groups, with 34 percent of families in the bottom half of the income distribution owning stock, compared with 78 percent of families in the 50th-90th decile (upper-middle income group) and 95 percent of families in the top decile (90th-100th).
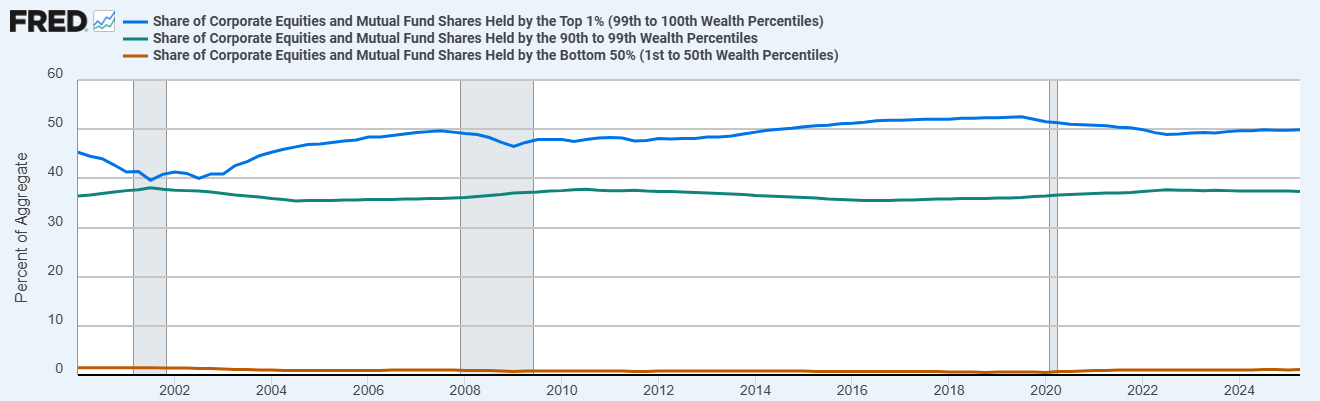
However, the value of stock owned varies greatly by wealth with the gap between the share of stock market value held by upper- and lower-income households increasing. The graph below shows the percentage of total U.S. stock value (corporate equities and mutual fund shares) owned by three different wealth percentile groups since 2000: 1) the top 1% wealth percentile (blue line), 2) the 90th to 99th wealth percentile (green line), and 3) the bottom 50% (1st to 50th) wealth percentile (brown line).
The percentage of the total value of corporate equities and mutual fund shares held by the top 1% wealth percentile grew from an approximate low of 40% in 2001 to 50% in 2025. The percentage of the total value of corporate equities and mutual fund shares owned by the 90th to 99th wealth percentile has fluctuated slightly but has remained relatively unchanged at approximately 37%. The percentage of the total value of corporate equities and mutual fund shares owned by the bottom 50% has only comprised less than 2% since the turn of the century, and declined from 1.5% in 2000 to only 1.1% in 2025.
Percentage of Total Value of U.S. Equities and Mutual Fund Shares Held by Wealth Percentile
Summary
In 2025 the S&P 500 index rose to record highs, but uncharacteristically was outperformed by several foreign broad stock market indexes. Despite the implementation of global tariffs by the United States, foreign markets were resilient. However, in a major shift for stock market performance, the U.S. stock market lagged behind most major foreign stock markets. The stock market performance of Mexico, Canada, the United Kingdom, Germany, Japan, and China exceeded the performance of the S&P 500. The stock markets of America’s top three trading partners – Mexico, Canada, and China, all outperformed the S&P 500 despite significant U.S. tariffs. Canada and Mexico vastly outperformed, with stock market returns of 28.93 percent and 25.17 percent, respectively, compared to the 16.39 percent for the U.S.
Stock valuations continued to climb in 2025 as AI fueled increased earnings growth expectations, and were a growing cause of consternation for financial markets. The S&P 500 multiple ended 2025 approaching 31, its highest level since 1999, excluding inflated multiples due to depressed earnings in recessionary years.
Good stock market performance has contributed to a growing K-shaped economy. The percentage of the total value of corporate equities and mutual fund shares held by the top 1% wealth percentile grew from an approximate low of 40% in 2001 to 50% in 2025. The percentage of the total value of corporate equities and mutual fund shares owned by the bottom 50% has only comprised less than 2% since the turn of the century, and declined from 1.5% in 2000 to only 1.1% in 2025.
The new year brings in much uncertainty; it could be quite a ride.
For further information:
- From Investopedia: S&P 500 Average Return and Historical Performance
- From Morningstar:
- From the Motley Fool: These 5 Artificial Intelligence (AI) Stocks Make Up 28.8% of the Entire S&P 500 Index
- From the Federal Reserve:
- From Multpl.com: Market Multiple

Kevin Bahr is a professor emeritus of finance and chief analyst of the Center for Business and Economic Insight in the Sentry School of Business and Economics at the University of Wisconsin-Stevens Point.