In 2025 tariffs became one of the dominating topics affecting the U.S. economy and international relations. That trend continued in 2026, as the U.S. Supreme Court invalidated some of the tariffs in February, changing the economic and political landscape once again. This blog will review the U.S. Supreme Court decision, recount recent tariff history, and evaluate the impact of the tariffs on trade.
Tariffs
A tariff is basically a tax paid by a U.S. business to the U.S. government for importing goods from a foreign country. The business importing the goods pays the tariff, not the foreign country sending the goods to the United States. Tariffs are a regressive tax, hitting lower and middle-income Americans to a greater degree than wealthier Americans, because lower and middle-income Americans spend a greater share of income on goods and buy relatively lower cost, imported goods to a greater degree. Tariffs typically lead to higher retail prices as importers try to pass on (at least some of) their higher costs onto consumers. In 2025, tariffs impacted prices, revenue collected by the federal government, trade, and international relations.
Tariffs represent an increase in the government regulation of international trade and impact financial markets. In 2025, U.S. imports and exports of goods totaled approximately $3.4 trillion and $2.2 trillion, respectively. With the U.S. population at nearly 350 million, import product demand was nearly $10,000 per U.S. resident.
Prior to 2025, global tariff rates were relatively low since early this century. The weighted mean tariff rate was generally below 5% for most countries since 2010. The weighted mean tariff rate is calculated by taking the average of effectively applied tariff rates for various products imported by a country with each rate weighted according to the volume or value of imports for that product. The weighted mean tariff rate is a key measure of the overall average tariff rate paid by importers and reflects the trade patterns of a country. A brief spike in the U.S. rate occurred in 2019 due to Trump Administration initiated tariffs, but trade wars rescinded in 2020 and tariff rates declined. The U.S. mean tariff rate had spiked to 13.8% in 2019 but declined to 1.5% in 2020. The era of relatively low tariffs changed in 2025, when the United States increased tariff rates on imports from trading partners primarily based on U.S. trade deficits.
The parade of 2025 U.S. implemented tariffs began in February when President Trump signed an executive order targeting Canada, Mexico, and China, America’s top three trading partners. On April 2, the Trump Administration announced a minimum 10% global tariff rate, with country specific tariff rates ranging from 10% to approximately 50%. Although the Trump Administration referred to the new tariffs as “reciprocal”, the rates were not based on the tariff rates charged on U.S. imports by a given country. Rather, the “reciprocal” tariff rates were based on a mathematical formula related to the U.S. trade deficit with a given country. The greater the trade deficit with a given country relative to imports from that country, the greater the “reciprocal” tariff rate. The tariff formula used by the Trump Administration focused on merchandise trade deficits and did not take into account international trade in services, investments (including foreign holdings of U.S. Treasury securities), or the size of a country’s economy.
The reciprocal tariff rates announced by the U.S. on April 2 were just the beginning of a roller coaster ride of tariff rate revisions. A week later on April 9, the Trump administration announced a 90-day pause from the “reciprocal” tariffs, although the global tariff rate of 10% remained in effect. August 1 became the deadline (later extended to August 7) for countries to negotiate trade deals with the U.S., or face the return of the “reciprocal” tariffs. The 25% tariff rate (with certain product exceptions) was paused for Canada and Mexico on products covered by the USMCA (the 2020 U.S. trade agreement with Canada and Mexico). The trade war escalated with China, and by the end of April the U.S. had a 145% reciprocal tariff rate on goods imported from China (with certain exceptions) with China having a reciprocal rate of 125% on U.S. goods. Negotiations led to the reciprocal tariff on China being lowered to 10% for 90 days on May 12; additional tariffs (justified by fentanyl and China’s unfair trade practices) applied to bring an effective rate of 30-55% for most products. In October, the fentanyl tariff on China was reduced from 20% to 10% and the 10% reciprocal tariff extended for one-year.
With an August 7 deadline of U.S. tariffs reverting to the April 2 “reciprocal” rates unless trade deals were reached, multiple trade deals were finalized by the deadline. Reciprocal rates were “adjusted” to reflect trade deals. The focus of the Trump Administration on trade has been an implicit objective of reducing or eliminating trade deficits with trading partners, with an added goal of increasing manufacturing jobs. The United States has the largest economy in the world and dwarfs the economies of many of its trading partners. The U.S. trade deficits are not surprising given the size disparity of economies and the ability of the United States to afford more goods.
The Trump Administration imposed tariffs based on the International Emergency Economic Powers Act (IEEPA), Section 232 of the Trade Expansion Act of 1962, and Section 301 of the Trade Act of 1974. The IEEPA gives the president the authority to regulate economic transactions following a declaration of a national emergency. The Trump Administration became the first presidential administration to invoke tariffs based on the IEEPA. The “reciprocal tariffs” were based on the IEEPA, as were the “fentanyl” tariffs on Canada, China, and Mexico. A minimum baseline (reciprocal) tariff rate of 10% was imposed on all countries. Section 232 of the Trade Expansion Act of 1962 allows the U.S. government to impose tariffs on imports that threaten national security. Section 301 of the Trade Act of 1974 allows the U.S. government to place tariffs on goods from countries that are deemed to be engaging in unfair trade practices. Tariff rates may be “stacked” for a particular country, with the sum of multiple tariff rates determining the overall tariff rate.
Specific product tariffs (section 232 and section 301 tariffs) included the following:
- 50% tariff on steel and aluminum imports; 25% for U.K.; USMCA goods duty-free
- 50% tariff on copper imports; USMCA goods duty-free
- 25% tariff on all automobiles, with an exemption for U.S. content and a discount through April 2027 on parts tariffs for U.S.-assembled autos; reduced to 10% on the first 100,000 U.K. imports; reduced to 15% for Japan, E.U. and South Korea
- 25% on certain semiconductors and their derivatives; with exemptions for specific uses and trade agreements, including semiconductors that are used in U.S. data centers
- 25% tariff on medium/heavy-duty trucks and key parts; 10% buses; some USMCA relief
- 10% softwood; 25–30% upholstered furniture; 25–50% cabinets/vanities; USMCA goods duty-free
The reciprocal tariffs were implemented based on 2024 trade deficits. The table below contains information for the top ten U.S. trading partners based on trade prior to the 2025 tariffs. The table includes 2024 total trade, 2024 net exports, the “reciprocal” tariff rates announced April 2, 2025, the adjusted reciprocal tariff rates following the August 7 trade deal deadline, the 2024 trade-weighted average tariff rate, and the trade-weighted average tariff rate as of January 2026. Net exports are defined as exports from the United States to a foreign country minus imports. If net exports are positive, the United States has a trade surplus; if net exports are negative, the United States has a trade deficit. Reciprocal tariffs include the fentanyl tariff for Canada, Mexico, and China. The adjusted reciprocal tariff rate reflects any trade agreement or tariff rate adjustment made after April 2. The trade-weighted average tariff rate can differ from the reciprocal tariff rate because of additional layers of tariffs, including Section 232 tariffs (national security) and section 301 tariffs (unfair trade). The trade-weighted average tariff rate can also differ from the adjusted reciprocal tariff rate because of products excluded from tariffs, such as products covered in the USMCA. The United Nations Trade and Development has calculated the trade-weighted average tariff rate applied to each country based on the composition of exports to the U.S. in 2024. According to the Budget Lab at Yale University, the overall average effective tariff rate for the U.S. was 16.9% in January 2026, the highest since 1932, compared to 2.4% in 2024.
2024 Top 10 U.S. Trading Partners in Goods and Tariff Rates
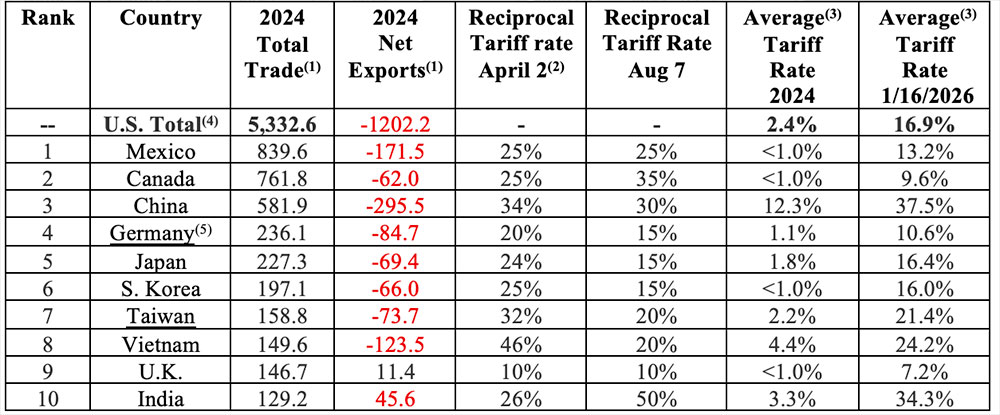
- Billions of dollars
- tariff rates for Mexico and Canada were established in March 2025
- Average tariff rate is trade-weighted
- Average U.S. tariff rates are per Budget Lab at Yale University
- tariff rates reflect rate for European Union; Germany is largest EU trading partner
In January 2026, the Trump administration announced additional tariffs of 10 percent would be imposed on eight European countries (Denmark, Norway, Sweden, France, Germany, the UK, the Netherlands, and Finland) for not supporting the U.S. acquisition of Greenland. The tariff was subject to increasing to 25% on June 1.
According to the U.S. Treasury, in 2025 tariff revenue comprised of customs duties, taxes, and fees, generated approximately $283 billion in revenue for the federal government, which was approximately 10.4% of the $2.7 trillion raised through individual income tax revenue. 2025 tariff revenue was approximately 0.7% of the $37.7 trillion federal debt outstanding as of September 30. The regulatory costs of administering the tariff program, including the regulatory costs to the U.S, government of enforcing the tariffs and the regulatory costs to businesses for complying with tariff laws, have not been disclosed nor deducted from tariff revenue numbers.
According to the Penn Wharton Budget Model of the University of Pennsylvania, tariff revenue collected under the International Emergency Economic Powers Act (IEEPA) is estimated to be around $164.7 billion through January 2026, accounting for approximately 50% of total customs duties since the reciprocal tariffs were initiated. In November 2025, the share of IEEPA tariff revenue by trading partner was: China 24%, European Union 15%, Vietnam 11%, India 8%, Mexico 4%, Canada 1%, Other countries 35%.
Tariffs and the Supreme Court
On Friday, February 20, the Supreme Court struck down tariffs that were implemented under the International Emergency Economic Powers Act (IEEPA), stating that the tariffs exceeded the powers given to the President by Congress under the 1977 law. No President had ever used the law to justify tariffs. The court was mute on whether or not the federal government should provide refunds to businesses that have paid IEEPA tariffs. Specific product tariffs invoked under Section 232 tariffs (national security) and section 301 tariffs (unfair trade) remain in place and were not part of the ruling.
Immediately following the Supreme Court ruling, President Trump signed an executive order imposing a new 10% global tariff. The following day, President Trump raised the tariff rate to 15%. The new executive order was based on Section 122 of the Trade Act of 1974, which permits a President to implement tariffs of up to 15% for 150 days, unless extended by Congress. The law allows the President to impose tariffs to address large and serious balance of payments deficits. No President had previously invoked Section 122 of the Trade Act of 1974 to implement tariffs. According to the Budget Lab at Yale University, the overall average effective tariff rate was 16% before the IEEPA tariffs were invalidated. Following the IEEPA decision the rate fell to 9.1%, but the implementation of Section 122 tariffs increased the rate to 13.7%. Any new, additional tariffs would further increase the rate.
Trade
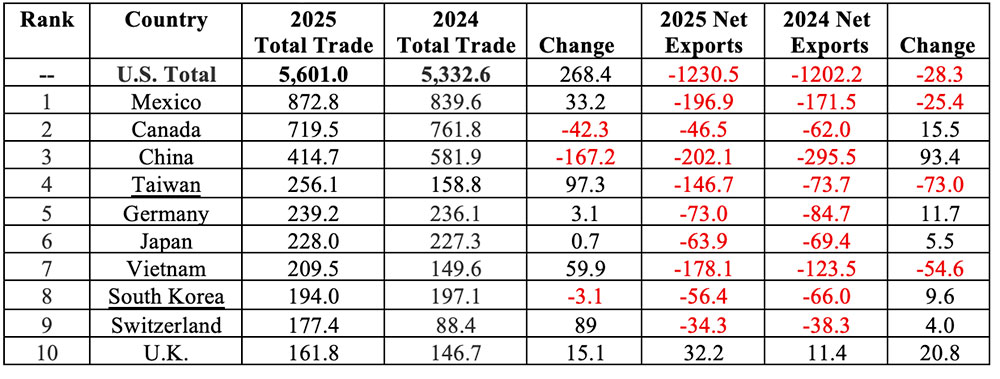
The table below lists the top 10 U.S. trading partners by trade in goods in 2025, and shows the total trade for 2025 and 2024, the change in trade, net exports for 2025 and 2024, and the change in net exports. A negative change in net exports means that the trade deficit increased; a positive change means that the trade deficit decreased. In 2025, total trade in goods rose 5.0% to $5.6 trillion. The U.S. trade deficit in goods rose to a record high of $1.23 trillion in 2025, with a 4.3% increase in imports.
In 2025, total trade in goods increased by $268.4 billion while the trade deficit increased by $28.3 billion. The top three trading partners comprised 35.8% of total trade in goods, with Mexico, Canada, and China, accounting for 15.6%, 12.8%, and 7.4% respectively. Trade in goods with the top 10 trading partners increased for seven countries, with the largest increases occurring for Taiwan ($97.3 billion) and Vietnam ($59.9 billion). The largest trade decrease was with China, with trade decreasing $167.2 billion. Trade deficits were recorded for nine of the 10 top trading partners in 2025, which was identical to 2024. In each year, there was a trade surplus with only the United Kingdom. The largest trade deficit decrease was with China, with a drop of $93.4 billion. Significant trade deficit increases occurred with Taiwan, Vietnam, and Mexico, with increases of $73.0 billion, $54.6 billion, and $25.4 billion, respectively.
2025 Top 10 U.S. Trading Partners in Goods and Changes in Trade
Summary
A tariff is basically a tax paid by a business to the U.S. government for importing goods from a foreign country. In 2025 tariffs were a dominating economic and political topic, as President Trump implemented broad “reciprocal” tariffs under the International Emergency Economic Powers Act (IEEPA), and product specific tariffs under Section 232 of the Trade Expansion Act of 1962 (national security) and Section 301 of the Trade Act of 1974 (unfair trade). Tariffs were in the spotlight for much of the 2025 economic landscape; that does not appear to be changing anytime soon in 2026.
On February 20, the Supreme Court struck down tariffs that were implemented under the IEEPA, stating that the tariffs exceeded the powers given to the President by Congress under the 1977 law. No President had ever used the law to justify tariffs. Specific product tariffs invoked under Section 232 tariffs (national security) and section 301 tariffs (unfair trade) remain in place and were not part of the Supreme Court ruling. The court was mute on whether or not the federal government should provide refunds to businesses that have paid the tariffs. Tariff revenue collected under the IEEPA comprised approximately 50% of total customs duties since the reciprocal tariffs were initiated.
In 2025 tariff revenue for the U.S. government rose significantly. Tariff revenue, comprised of customs duties, taxes, and fees, increased to approximately $283 billion. However, the cost to the U.S. government of administering the tariff programs and U.S. businesses adhering to the tariff programs, was not disclosed or deducted from the total tariff revenue figure. Tariff revenue for the federal government still fell far short of individual tax revenue. In 2025, tariff tax revenue was approximately 10.4% of individual tax revenue, and only approximately 0.7% of the $37.7 trillion federal debt outstanding of September 30. Tariff revenue collected under the IEEPA is estimated to be around $164.7 billion through January 2026, accounting for approximately 50% of total customs duties since the reciprocal tariffs were initiated.
Despite the tariffs, U.S. total trade and deficits increased in 2025. Total trade in goods rose 5.0% to $5.6 trillion, while the U.S. trade deficit in goods rose to a record high of $1.24 trillion with a 4.3% increase in imports. In the first quarter of 2025, U.S. companies front-loaded imports and inventory prior to the pending April reciprocal tariffs. The first quarter accounted for over 37% of the 2025 total trade deficit of $1.230 billion. Despite the tariffs, trade deficits occurred in every month in 2025, with the trade deficit over $98 billion in December. One of the goals of the 2025 tariffs was to increase manufacturing jobs. In 2025, that didn’t happen. Manufacturing employment decreased from 12.673 million in January 2025 to 12.585 million in December 2025, a decline of approximately 88,000 jobs.
2026 is shaping up to be another year of tariffs in the spotlight. Several countries entered into new or revised trade agreements with the U.S. following the implementation of the reciprocal tariffs. The status of those trade agreements is now subject to question. Immediately following the Supreme Court ruling on February 20, President Trump signed an executive order imposing a new 10% global tariff. The following day, President Trump raised the tariff rate to 15%. The new executive order was based on Section 122 of the Trade Act of 1974, which permits a President to implement tariffs of up to 15% for 150 days, unless extended by Congress. No President had ever previously invoked Section 122 of the Trade Act of 1974 to implement tariffs. What happens after 150 days remains to be seen.
No doubt tariffs will continue to be a topic of economic and political conversation in 2026, and potentially litigation. Uncertainty remains over 1) the potential expansion of product specific tariffs under Section 232 of the Trade Expansion Act of 1962 and Section 301 of the Trade Act of 1974, 2) new tariffs initiated based on new or existing legislation, 3) any refunds to businesses that paid IEEPA tariffs, 4) what happens in 150 days when the 15% tariff rate invoked under Section 122 of the Trade Act of 1974 expires, 5) new tariffs on European allies opposed to the U.S. annexation of Greenland, and 6) potential increased costs and complexities of any new tariffs. Tariffs were a dominating force on the 2025 economic stage. It currently looks like 2026 will provide a repeat performance.
For further information:
- From the Budget Lab at Yale University: Trade and Tariffs
- From the Penn Wharton Budget Model: Supreme Court Ruling and IEEPA Revenue
- From the Harvard Business School Pricing Lab – Digital Data Design Institute: Tariff Tracker
- From SCOTUSblog: Supreme Court strikes down tariffs – SCOTUSblog
- From the Peterson Institute for International Economics: Trump’s tariff revenue tracker: How much is the US collecting? Which imports are hit? | PIIE
- From the BBC: Trump Adjusted Reciprocal Tariffs by Country
- From Avalara: The Difference Between Tariffs
- From Reed Smith: Trump 2.0 tariff tracker | Trade Compliance Resource Hub
- From Holland & Knight: Supreme Court Strikes Down IEEPA Tariffs: What Importers Need to Know Now | Insights | Holland & Knight
- From the AP: Trump says he’ll raise tariffs to 15 percent after Supreme Court ruling | AP News
- From World Scorecard: US Tariffs and The World – Tariff Rates by Country
- From the U.N. Trade and Development: Tariff dashboard – tracking the evolution of US tariffs | UN Trade and Development (UNCTAD)
- From the U.S. Census Bureau and Bureau of Economic Analysis: U.S. International Trade
- From the U.S. Census Bureau:
- From the St. Louis Federal Reserve: How Tariffs are Affecting Prices
- From the Federal Reserve Bank of New Richmond: Tariff Revenue
- From PBS: Trump announces a 10% tariff on 8 European countries for opposing U.S. control of Greenland | PBS News
- From CNBC: Trump tariffs: After Supreme Court ruling, industries still face higher rates

Kevin Bahr is a professor emeritus of finance and chief analyst of the Center for Business and Economic Insight in the Sentry School of Business and Economics at the University of Wisconsin-Stevens Point.