
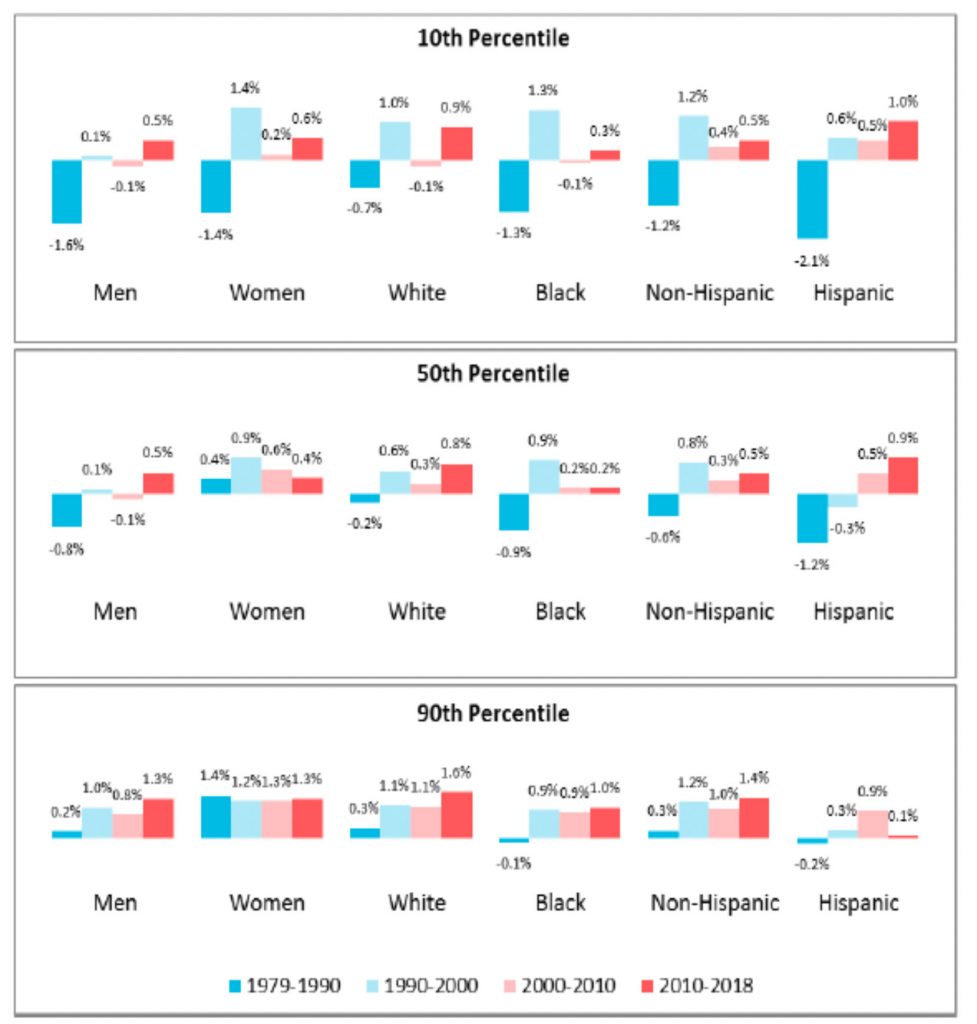
Part 2 of this blog discussed the Congressional Research Bureau’s report on the change in real wages between 1979 and 2018 across percentiles and demographics (Table 1). That report also goes a step further and breaks down the real wage changes across the various demographic groups across four time periods. Table 2 below depicts what happened to real wages during these time periods and shows the annualized change in real wages across percentiles and demographics during 4 distinct time periods: 1) 1979-1990, 2) 1990-2000, 3) 2000-2010, and 4) 2010-2018.
At the 10th income percentile, real wage growth was at best minimal in the 4 time periods. Real wage growth was actually negative across all demographics between 1979 and 1990. For men and Hispanics, 2010-2018 was the best period, with average annual wage growth of 0.5% and 1.0% respectively. For women, Whites, Blacks, and non-Hispanics, 1990-2000 was the best period, with annual real wage growth varying between 1.0% and 1.4%.
At the 50th percentile, real wage growth was better, but certainly not stellar. All groups except women saw negative real wage growth between 1979 and 1990. The period 2010-2018 was best for men, Whites, and non-Hispanics, with annual real wage growth varying between 0.5% and 0.9%. For women, Blacks and Hispanics, 1990-2000 was the best time period, with annual real wage growth varying between 0.8% and 0.9%.
At the 90th percentile, only Blacks and Hispanics saw negative real wage growth between 1979 and 1990. Beginning in 1990, real wage growth was pretty consistent across the demographic groups for the three subsequent time periods. For men, annual real wage growth varied between 0.8% and 1.3%, with the high occurring in the 2010-2018 period. For women, annual real wage growth varied between 1.2% and 1.4%, with the highest growth occurring 1979-1990. After 20 years of annual growth averaging 1.1%, real wages grew at an average annual rate of 1.6% between 2010 and 2018 for Whites. For Blacks, annual real wage growth only varied between 0.9% and 1.0%.; for non-Hispanics annual real wage growth varied between 1.0% and 1.4%. In each case, the highest growth occurred in the 2010-2018 time period. For Hispanics, annual real wage growth varied between 0.1% and 0.9%, with peak growth occurring 2000-2010.
Summarizing, annual real wage growth was greatest at the 90th percentile, generally across all demographics across all time periods. Only for the Hispanic group during the period 2010-2018 was wage growth higher at the 50th percentile than the 90th percentile. At the 50th percentile, annual real wage growth never exceeded 1.0% for any demographic over any time period. Although exceptions occurred during the period 1990-2000, generally real wage growth at the 10th percentile has also been week, with annual real wage growth generally less than 1.0%.
Table 3 – Annualized Real Wage Growth Across Decades by Percentiles and Demographics
CBEI Blog Series: Real Wage Growth (or Lack Thereof)
Part 1: The Last Decade
Part 2: The Long Run: 1979-2018
Part 3: By Decade
Part 4: Economic Growth, Unemployment and Wage Growth

Kevin Bahr is a professor emeritus of finance and chief analyst of the Center for Business and Economic Insight in the Sentry School of Business and Economics at the University of Wisconsin-Stevens Point.