
Well, it’s everybody’s favorite time of the year – election time. The divisions in America have perhaps never been greater. This blog may not lessen those divisions, but the goal is simple – to help voters make an informed voting decision. Here’s hoping that everyone votes, and that every vote gets counted. This blog will provide a summary comparison of the economic policies of Donald Trump and Joe Biden on four key issues: 1) corporate taxes, 2) individual taxes, 3) Social Security and 4) healthcare. Links to supporting websites and articles are provided at the end of this blog for greater information.
Corporate Taxes
Background
Under both President Bush and President Obama, the statutory corporate tax rate was 35% and capital expenditures (spending on property, plant, and equipment) were depreciated (the cost was a tax deduction that was allocated over a certain number of years). The statutory tax rate is the legal rate that corporations pay on taxable income. Corporations also get deductions and credits, so not all income is taxable income, and the tax rate that companies actually pay on taxable income (the effective tax rate) can be significantly less than the statutory rate.
Trump
The most significant changes from the 2018 tax bill under President Trump impacted corporations. The significant benefits to corporations included the following: a reduction in the statutory corporate tax rate from 35% to 21%, 2) capital spending (spending on property, plant, and equipment) could be immediately expensed rather than depreciated, and 3) the taxation of repatriated foreign income (foreign income brought back to the U.S.) was significantly lowered.
Here is what those changes meant. The reduction from 35% to 21% in the statutory rate puts the rate at its lowest level since the 1930s (it was lowered to 35% under President Reagan with the Tax Reform Act of 1986). Unlike the individual tax cuts, the corporate tax cut is permanent (no ending date, unless changed by law), The expensing of capital spending is another benefit. Rather than depreciating (allocating) the cost of property, plant, and equipment over a certain number of years as required previously, companies could expense (take a full deduction for) the entire amount beginning in 2018. In other words, an immediate tax benefit for the full amount spent. The expensing of capital spending is allowed through 2022. Finally, the reduced taxation on foreign income is a major benefit for companies wishing to send foreign income back to the U.S.
The statutory corporate tax rate was lowered from 35% to 21%, but the effective rate (the tax rate companies actually pay on their taxable income) can be significantly lowered through tax credits and taxable income lowered through deductions. According to a study by the Institute on Taxation and Economic Policy (see link at end of blog), the effective tax rate for the 379 profitable companies in the Fortune 500 was 11.3% in 2018. A total of 91 of the Fortune 500 companies, including Amazon, IBM, and General Motors, paid no corporate taxes in 2018.
Biden
Biden’s plan features raising the corporate tax rate to 28 percent and imposing a 15% minimum tax on a corporation’s book income. In some instances, corporations may have greater deductions for tax purposes, thereby reducing their taxable income but showing greater (book) income to investors. The minimum tax would provide a floor for the effective tax rate. In addition, Biden’s plan includes a minimum tax on all foreign earnings of United States companies located overseas and imposing a tax penalty on U.S. companies that shift jobs overseas that result in products being sold back to America.
Individual Taxes
Background
The federal income tax structure is a progressive tax structure. As your taxable income increases, you progress into higher tax brackets with higher tax rates. However, taxable income can be reduced by deductions and credits. There are currently 7 individual income tax brackets. Each tax bracket has a specified tax rate. As your taxable income increases and you progress to a higher income bracket, the tax rate that applies to that bracket will also increase. The rates apply to the income in a given bracket. Note – an important point is that everyone pays the same rate for taxable income in a given bracket.
Under President Bush, there were 6 tax brackets. Under President Obama, the number of tax brackets was expanded to 7. The tax rates that applied to the tax brackets were the same under each president, with one exception. The only thing that changed under President Obama was the addition of a 39.6% top tax rate that applied to a new top tax bracket. The new bracket applied to taxable income over $400,000 for individuals and $450,000 for couples. The 39.6% rate had been the top tax rate that applied to the highest tax bracket under President Clinton. Relative to President Clinton, tax rates that applied to each tax bracket were lowered under President Bush. The tax cuts implemented under President Bush were initially scheduled to end in 2010, which meant that tax rates would have reverted to the higher rates that existed under President Clinton. However, Congress approved keeping the rates in place under President Obama, the only exception being the increased rate for the highest tax bracket.
In addition to lowering tax rates by income bracket, the Bush Tax Cuts also lowered taxes on certain dividends (cash payments to shareholders) and long-term capital gains (gains on financial assets). Dividends were formerly taxed at an individual’s ordinary tax rate (the ordinary tax rate is the tax rate that applies to your tax bracket); under President Bush the dividend tax rate was reduced to 15% for “qualified” dividends, basically dividends on stock that was held for a required minimum time period. The long-term capital gains tax rate was reduced from 20% to 15% (5% in tax brackets of 10% and 15%). These rates, implemented under President Bush, generally remained in place under President Obama. The long-term capital gains and qualified dividend tax rate was increased to 20% for taxpayers in the 39.6% marginal tax bracket and an additional net investment income tax of 3.8% was applied on the capital gains of high-income earners.
The standard deduction and exemption amount were relatively the same under President Obama relative to President Bush, with the amounts each year generally adjusted slightly by the approximate rate of inflation.
Trump
Beginning in 2018, tax law changed under the Trump administration. The new tax law kept the seven tax brackets that existed under President Obama, with the bracket amounts adjusted slightly. However, the tax rates that apply to each tax bracket were generally reduced by approximately 2-4%. This was very similar to what was implement in the tax changes under President Bush – the tax rates that applied to each bracket were generally reduced. Also similar to the tax law implemented under President Bush, the changes implemented in 2018 are for a limited period of time. The changes begin in 2018 and expire after 2025, unless extended by law. The standard deduction was approximately doubled and the personal exemption (deductions for dependents) eliminated, resulting in fewer taxpayers itemizing deductions. The bottom line, The Tax Policy Center (see link at end of blog) estimated that in 2018 the average tax reduction was approximately $1,600, with taxpayers in the top 5% of the income distribution receiving the greatest benefit.
Long-term capital gains and dividends are taxed under the 2018 tax bill very similarly to what was in place under President Obama, including the 3.8% additional investment tax on high earners.
Biden
Biden’s plan would include raising individual income taxes on those taxpayers making greater than $400,000. Taxes would not be raised on those making less than $400,000. The top individual income tax rate would be increased back to 39.6 percent, the top rate that had been in place under President Obama. The 2018 tax law lowered the top tax rate from 39.6 percent to the current 37.0 percent. Taxes on long-term capital gains and qualified dividends on income above $1 million would be at the ordinary (proposed) income tax rate of 39.6 percent, rather than the current 20 percent.
A variety of tax credits have been proposed under the Biden plan:
- Tax credits would be increased for children and childcare. The Biden plan offers up to $8,000 in tax credits to help low-income and middle-class families pay for childcare. The Child Tax Credit would be increased from the current $2,000 to $3,000 per child for children ages 6 to 17 and $3,600 for children under 6.
- A tax credit of up to $15,000 would be available for first-time home buyers.
- Spending on health insurance would be capped through tax credits. No family would spend more than 8.5% of their income on health insurance due to expanding access to refundable health premium tax credits.
- A tax credit would also be available for caring for an aging loved one.
Social Security
Background
Social Security programs are primarily funded through payroll taxes. Since 1990, employees and their employers have each paid 6.2% (4.2% for employees in 2011 and 2012) of earnings for Social Security taxes; 1.45% of earnings for Medicare taxes. (Rates were slightly lower prior to 1990.) In sum, a total of 15.30% of an employee’s earnings are subject to Social Security and Medicare taxes, with employee and employer each paying 7.65% of an employee’s earnings. Social Security taxes are up to a salary limit of $137,700 in 2020. People who earn more than the taxable maximum do not pay Social Security taxes on that amount or have those earnings factored into their future Social Security payments. There is no wage limit for the Medicare tax. Beginning in 2013, workers pay an additional 0.9 percent Medicare tax on income exceeding certain thresholds: $200,000 for single taxpayers, $250,000 for married.
Current payments into Social Security are being dispersed to those receiving benefits now – excess payments remain in Social Security trust funds. In other words, payments that you make into the Social Security system are NOT set aside for you. Current payments go to current beneficiaries. If a shift occurs in the age distribution of the U.S. population (which it did), problems can occur with the system.
Each year the Trustees of the Social Security and Medicare trust funds report on the current and projected financial status of the programs. The 2020 report does NOT take into account the impact of Covid-19 on the economy nor the Trump administration’s current deferral of Social Security payroll taxes. According to the Trustees “Social Security and Medicare both face long-term financing shortfalls under currently scheduled benefits and financing.”
In 2020, Social Security’s total cost is projected to exceed its total income in 2020 for the first time since 1982. Money is withdrawn from the trust funds when current payments into Social Security are less than disbursements. The demographic shifts and aging population in America have created strains in the financing of Social Security programs. Disbursements are expected to continue to exceed program income after 2020. The retirement and survivors benefits (OASI) trust fund is expected to remain solvent until 2034; the disability benefits (DI) trust fund is expected to remain solvent until 2065. There are two different trust funds relating to Medicare; one of those trust funds is projected to be depleted in 2026.
The financial strains on Social Security and Medicare mean that something will have to change – either benefits, the financing of programs, or both.
Trump
The Trump administration’s proposed 2021 budget (see link at end of blog) included significant cuts to the Social Security Disability Insurance (SSDI) program, as well as cuts to Medicare and Medicaid. Details for future funding and benefits for Social Security retirement have not been disclosed.
In August, the Trump administration announced (through Executive Order) a four-month payroll tax deferral (6.2%) from September through December for certain eligible workers. It is theoretically a deferral, not a permanent tax cut, so the payroll tax would be 12.4% in the first four months of 2021 for employees participating in the tax deferral. Any permanent reduction in the payroll tax rate would negatively impact Social Security funding.
Biden
Currently, employees and their employers each pay 6.2% of earnings for Social Security taxes; 1.45% of earnings for Medicare taxes. Taxes are deducted for Social Security up to a salary limit of $137,700 in 2020; there is no salary limit for deducting Medicare taxes. The Biden plan features increasing the financing of Social Security through implementing the 12.4 percent payroll taxes on wages above $400,000, which would be evenly split by the employee and the employer.
Biden is also proposing offering Americans that have worked for at least 30 years a retirement benefit that is at least 125 percent of the federal poverty level.
Healthcare
The Affordable Care Act (“Obamacare”) was passed in 2010 in an effort to provide a starting point for national health care. The objective of the Act was to make buying health coverage easier and more affordable, with insurance companies competing for business through state-based American Health Benefit Exchanges. Through the exchanges, individuals can purchase coverage, with premium and cost-sharing credits available to individuals/families (based on income); small businesses may also be able to purchase coverage. The number of health insurance firms competing for business varied by state. Insurance plans were required to cover “Essential Health Benefits,’ including certain services such as doctors’ services, inpatient or outpatient hospital care, prescription drugs, pregnancy, childbirth, and mental health. Most people were required to have health insurance or be charged a fine by the federal government.
Healthcare coverage and costs remain a concern for many Americans. From the Kaiser Family Foundation (see link at end of blog) based on data collected from 2019 surveys:
- Despite the recent economic expansion, what employers and workers pay toward premiums continues to rise more quickly than workers’ wages and inflation over time. Since 2009, average family premiums have increased 54% and workers’ contribution have increased 71%, several times more quickly than wages (26%) and inflation (20%).
- About one-fourth of U.S. adults (26 percent) say they or a household member have had problems paying medical bills in the past year, and about half of this group (12 percent of all Americans) say the bills had a major impact on their family.
- At least one-fourth of insured adults indicate it is difficult to afford to pay their deductible, the cost of health insurance each month, or their co-pays for doctor visits and prescription drugs.
Note the above is based on 2019 surveys – before COVID-19. The financial strains caused by COVID-19 increased the stress of paying healthcare (and other) costs. Healthcare costs remain a concern.
Trump
A core principle of the Trump administration has been working toward repealing President Barack Obama’s Affordable Care Act (ACA). The challenges of simply repealing Obamacare were demonstrated in 2017, when Republicans controlled both the House and the Senate. Although three major (Republican) proposals were presented in 2017, none passed Congress and became law. In early 2017, House Republicans introduced and later revised the American Health Act. Although it was passed in the House, the American Health Act ran into trouble in the Senate. The Senate came up with their own version of healthcare, the Better Care Reconciliation Act of 2017, which was introduced in June 2017. That bill also failed to pass. In late 2017, the Graham-Cassidy-Heller-Johnson Amendment was never brought to a vote in the Senate because it would not have passed.
There were two major obstacles for the alternative proposals to Obamacare:
- the number of uninsured Americans that would result from the legislation, and
- Medicaid funding.
According to the Congressional Budget Office (see links at end of blog) each of the proposals would have resulted in a significant increase of uninsured Americans. Also, in each case, there was a significant change as to how Medicaid would be funded. Medicaid (insurance for the poor and disabled) funding would be capped, with states having the option to pick-up the reduced funding, or not. (In other words, funding is capped so there will be limitations as to what costs and who will be covered.) This results in less funding, the potential for changes in eligibility, and fewer people insured. The Obamacare Individual Mandate, which required individuals to have insurance or be subject to a fine, was repealed by the 2018 tax bill. The objective of the mandate was to lower overall insurance premiums by expanding the pool of insured Americans to include healthy, as well as not-so-healthy, Americans.
As of 2020, Obamacare remains the law of the land. However, the Trump administration has pursued repealing Obamacare through the courts and pending changes to the U.S. Supreme Court may impact the likely success of that pursuit. A detailed replacement for Obamacare has not been presented by the Trump administration. If Obamacare is repealed, the Economic Policy Institute (see link at end of blog) estimates that nearly 30 million Americans will lose healthcare coverage.
Biden
The Biden plan would build on and expand the Affordable Care Act. Healthcare options would include a new public health insurance option similar to Medicare. This option would negotiate with hospitals and providers directly with the objective of lowering healthcare costs. The public health insurance option would be an option; not a requirement. Americans could choose an employer health plan, purchase their own insurance, or opt into the public health option.
Healthcare coverage costs would be capped at 8.5 percent of income. Tax credits would be expanded with the objectives of providing greater coverage and lower out-of-pocket costs.
A focus of the plan is to increase coverage for low-income Americans. The public health option would be provided to individuals in states that did not expand Medicaid eligibility (including Wisconsin) as allowed by the Affordable Care Act. States that have already expanded Medicaid will have the choice of moving the expansion population to the premium-free public option. People making below 138% of the federal poverty level will be automatically enrolled if they interact with certain institutions (such as public schools) or other programs for low-income populations (such as SNAP).
In Conclusion – The U.S. Budget Outlook and Choices to be Made
Unfortunately, everything has a cost. Tax cuts have a cost. Healthcare has a cost. Nothing is free. Ultimately, it should be up to Americans how much the government collects in taxes, how much individuals and corporations pay in taxes, how the government spends the tax revenues, and what services are provided by the government. The funding of the government through tax revenues and services provided will have a profound impact on Americans and would be significantly different between a Biden and Trump administration.
On September 21, 2020, the Congressional Budget Office (CBO) released its Long-Term Budget Outlook for the U.S. (a direct link to the CBO report is provided at the end of this blog). It presents the fiscal challenges that will be faced by future administrations. The CBO Budget Outlook includes the following assumptions
- The economic impact of COVID-19 is included in the analysis.
- Current laws affecting revenues and spending generally remain unchanged.
- Individual tax rates revert to their 2017 levels in 2025 due to the 2018 tax bill sunset provisions.
- The current corporate tax rate of 21% remains intact as it has no sunset provision.
- Spending for Medicare and Social Security continues as scheduled even after their trust funds are exhausted.
The following are key results taken directly from the CBO analysis:
- “Deficits. Even after the effects of the 2020 coronavirus pandemic fade, deficits in coming decades are projected to be large by historical standards. In CBO’s projections, deficits increase from 5 percent of gross domestic product (GDP) in 2030 to 13 percent by 2050—larger in every year than the average deficit of 3 percent of GDP over the past 50 years.”
- “Debt. By the end of 2020, federal debt held by the public is projected to equal 98 percent of GDP. The projected budget deficits would boost federal debt to 104 percent of GDP in 2021, to 107 percent of GDP (the highest amount in the nation’s history) in 2023, and to 195 percent of GDP by 2050.”
- “High and rising federal debt makes the economy more vulnerable to rising interest rates and, depending on how that debt is financed, rising inflation. The growing debt burden also raises borrowing costs, slowing the growth of the economy and national income, and it increases the risk of a fiscal crisis or a gradual decline in the value of Treasury securities.”
- “Spending. After the effects of increased spending associated with the pandemic dissipate, spending as a percentage of GDP rises in CBO’s projections. With growing debt and higher interest rates, net spending for interest nearly quadruples in relation to the size of the economy over the long term, accounting for most of the growth in total deficits. Also increasing are spending for Social Security (mainly owing to the aging of the population) and for Medicare and the other major health care programs (because of rising health care costs per person and, to a lesser degree, the aging of the population).”
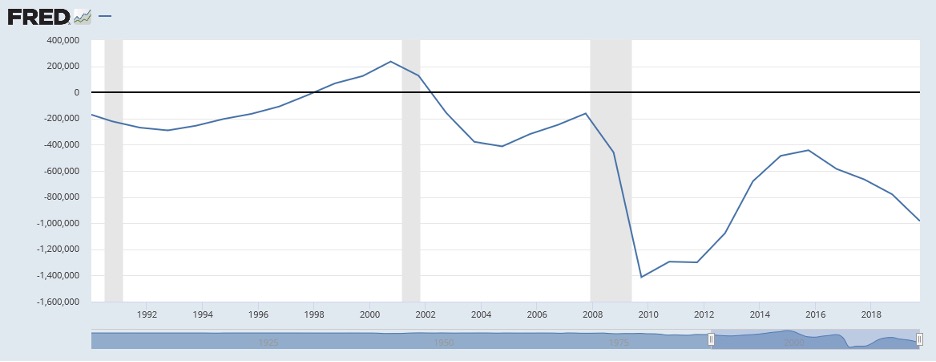
Summarizing the debt and deficit analysis by the CBO – both increase significantly. In particular, federal debt explodes to 195% of GDP by 2050 if current government revenue and spending streams do not change. That’s another way of saying that something will have to change. Tax revenues, the mix of those revenues, and government spending on programs. One or more of those variables will have to change. A federal debt to GDP level of 195% would put the U.S. economy in an extremely precarious position, with increasing borrowing costs, potential inflation, increased interest rates, and even the possibility of a significant financial crisis.
The CBO analysis of federal deficits and debt reflects the fiscal challenges to future administrations. The Covid-19 impact on the economy exacerbated the increasing federal deficits that occurred since the 2018 tax bill. After declining since the financial crisis, the 2018 tax cuts contributed to the federal deficit expanding once again.
Federal Budget Surplus or Deficit
Annual amount of Federal Budget Surplus or Deficit in Millions of Dollars (1/1/80-9/30/19)
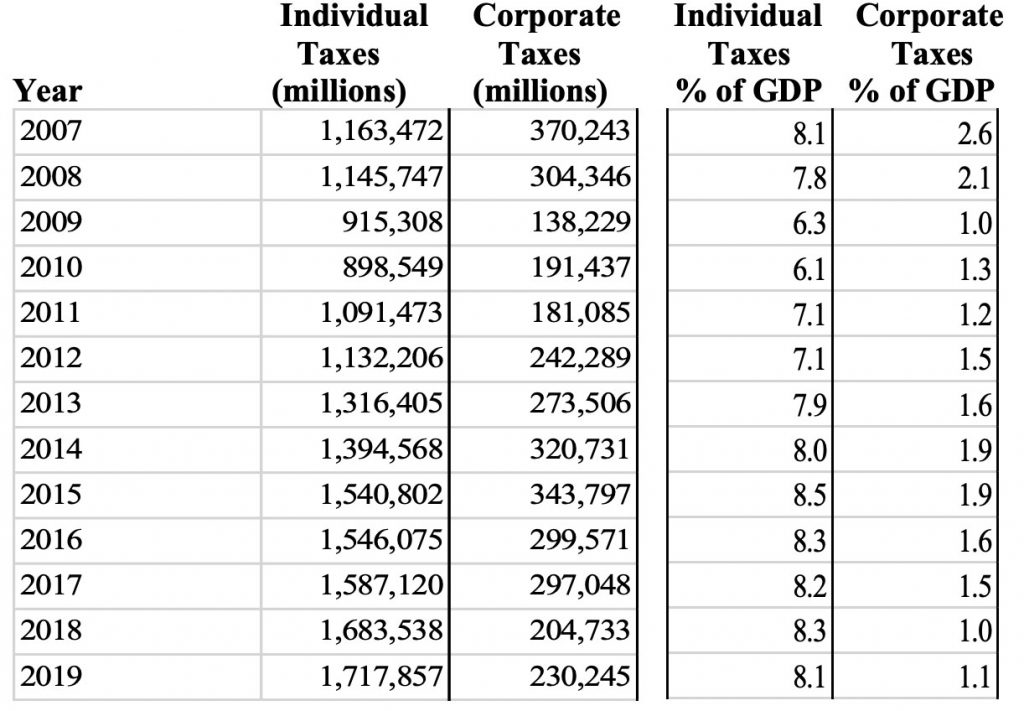
The impact of the 2018 tax cuts on individual and corporate tax revenues is indicated in the table below. Tax revenues in periods of economic growth, in absolute numbers and as a percent of GDP, will generally increase as corporate profits and individual incomes increase. Changes in 2018 federal tax revenues demonstrate that the individual tax cuts were relatively minor compared to the corporate tax cuts. Relative to 2017, corporate tax revenues declined 31.1% to $204.7 billion in 2018 while individual tax revenue increased 6.0% to $1.683 trillion. As a percent of GDP, individual taxes increased from 8.2% to 8.3%, while corporate taxes declined from 1.5% to 1.0%. Relative to their 2007 pre-financial crisis level, 2018 individual taxes increased 44.7% versus a decline of 44.7% for corporate taxes. Relative to 2007, as a percent of GDP, 2018 individual taxes increased from 8.1% to 8.3% while corporate taxes declined from 2.6% to 1.0%.
As indicated earlier, Social Security programs are primarily funded through payroll taxes. Social Security provides estimates of retirement payments to those that are eligible to receive Social Security retirement benefits. However, payments that you make into the Social Security system are NOT set aside for you. Current payments into Social Security are being dispersed to those receiving benefits now. If a shift occurs in the age distribution of the U.S. population, problems can occur with the system. The CBO budget outlook reflects a continuing trend of the aging of the U.S. population. By 2050, CBO projects 22 percent of the population will be 65 or older compared to only 16 percent today.
Given the aging of the population, Social Security and Medicare expenses will increase. As a percentage of GDP, the CBO expects Social Security expenditures to increase from 5.3% in 2020 to 6.3% in 2050 while revenues (taxes) decline from 4.9% to 4.4%. Medicare expenditures will increase from 4.2% to 7.1% while revenues (taxes) increase from 1.5% to 1.7%. Clearly, increased funding of Social Security programs will have to occur if benefit levels are to be maintained.
Finally, the issue of healthcare. As indicated earlier, healthcare coverage and costs remain a primary concern for many Americans. The United States features a primarily privatized health care system yet spends more on healthcare that any other developed country (by far) on a per capita basis. According to the Organisation for Economic Co-operation and Development (OECD) in 2019 the United States spent $11,072 per capita on healthcare. Switzerland was second at $7,732 per capita. Per capita healthcare spending by other countries includes Germany at $6,646, Canada at $5,418, France at $5,376, and the United Kingdom at $4,653 (see link at end of blog).
According to a Best Countries survey by U.S. News (see link at end of blog), despite the high per capita cost of healthcare, the U.S. ranked only 15th on the list of best healthcare systems. The results are based on a survey that included over 20,000 respondents from around the world to assess perceptions of 73 countries on 65 different metrics. The top 5 countries for healthcare were: 1) Denmark, 2) Sweden, 3) Canada, 3) United Kingdom, and 5) Germany. All 5 countries have some form of national healthcare.
Healthcare will remain a controversial topic in the United States. Providing Americans with access to quality healthcare, how to pay for that coverage, and what that coverage should cost will remain controversial issues with different approaches between administrations.
Corporate taxes, individual taxes, Social Security, and healthcare. Major issues for Americans, with significant differences between Biden and Trump administrations as to how these issues will be dealt with.
For further information:
- Institute on Taxation and Economic Policy on corporate taxation after the 2018 tax bill: Corporate Tax Avoidance
- Bankrate.com discussed Trump and Biden policies: Trump vs. Biden
- The Tax Policy Center analysis of the 2018 tax bill: Distributional Effects of 2018 Tax Cuts
- A summary of the financial status of Social Security from the Trustees: www.ssa.gov/oact/TRSUM
- From the Social Security Administration, how Social Security is financed: SS Financing
- Trump administration 2021 budget: Trump 2021 Budget
- Information on Health Care from the Kaiser Family Foundation: Data Note: Americans’ Challenges with Health Care Costs
- The CBO analysis of the American Health Care Act: American Health Care Act | Congressional Budget Office
- The CBO analysis of the Better Care Reconciliation Act: H.R. 1628, Better Care Reconciliation Act of 2017 | Congressional Budget Office
- The CBO preliminary analysis of Graham-Cassidy: Preliminary Analysis of Legislation That Would Replace Subsidies for Health Care With Block Grants | Congressional Budget Office
- From the Economic Policy Institute: Impact of ACA Repeal
- From the Kaiser Family Foundation: State Medicaid Expansion
- From the Office of Management and Budget, tax revenue by source (see Tables 2.1 and 2.2): www.whitehouse.gov/omb/historical-tables
- From the Congressional Budget Office: U.S. Long-term Budget Outlook
- From the Organization for Economic Development Countries (OECD): Healthcare Spending by Country
- From U.S. News: Countries With the Most Well-Developed Public Health Care Systems

Kevin Bahr is a professor emeritus of finance and chief analyst of the Center for Business and Economic Insight in the Sentry School of Business and Economics at the University of Wisconsin-Stevens Point.