
Inflation Overview
There are two broad factors that affect prices – supply and demand. Generally, inflation is caused when there is a change to one of these factors. If the supply of goods is reduced for a given demand, prices (inflation) will increase until a higher price level is reached that balances the demand to match the reduced supply. If the demand for goods is increased for a given supply, prices (inflation) will increase until a higher price level is reached that balances the supply of goods to match the increased demand.
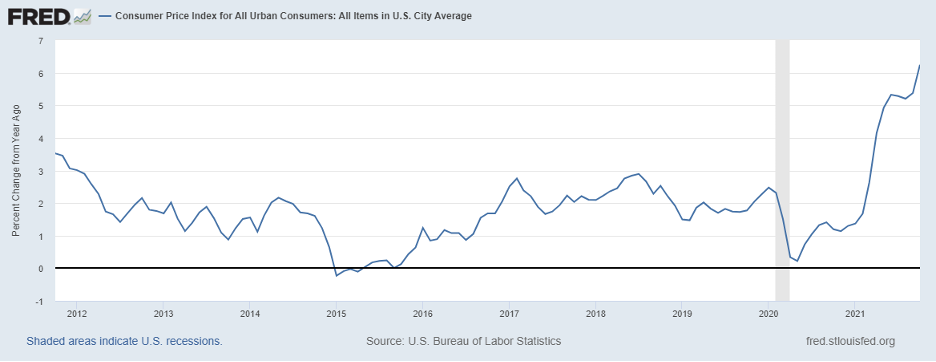
The chart below shows the 12-month change in the Consumer Price Index (CPI) over the past ten years. The change in the CPI is used to measure the rate of inflation, which is the percentage change in prices. Generally, the rate of inflation varied between 1% and 3% over the past decade, although the rate approached 4% in late 2011 as the economy rebounded following the financial crisis. After a January 2012 rate of 3.0%, inflation remained below 3.0% through 2020. In 2020, inflation dipped below 1% due to the severe economic contraction caused by COVID.
12-month Percent Change in CPI for all Urban Consumers, October 2011 – October 2021
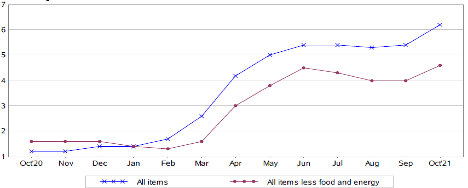
The chart below focuses on the rate of inflation between October 2020 and October 2021. Things changed in 2021. In 2021, inflation began the year at only 1.4%, but by October inflation jumped to 6.2%, a 4.8% increase. The effect of COVID on the economy created a collage of factors that contributed to a highly unusual jump in inflation.
The Bureau of Labor Statistics provides monthly data since 1948 on the 12-month percent change in the rate of inflation. The 4.8% increase that occurred between January and October of 2021 was the second largest increase in inflation that occurred in any year since 1948. The oil embargo and energy crisis in 1973 contributed to the largest increase in inflation in any year, as inflation rose from 3.6% to 8.9%, a jump of 5.3%. Both 1973 and 2021 featured “supply shocks” to the U.S. economy. Energy prices rose sharply in each case, but supply chain interruptions extended beyond energy in 2021. The novelty for the U.S. economy in 2021 – inflation was caused by changes in both supply and demand.
12-month Percent Change in CPI for all Urban Consumers, October 2020 – October 2021
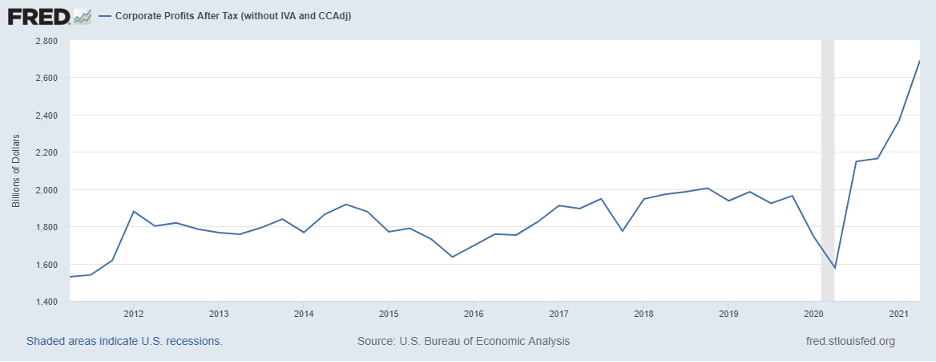
There is no question that the short-term pain created by the significant increase in inflation is real to U.S. consumers. Although the effect on consumers has been painful, corporate profits have been at record levels, indicating that increased corporate costs have generally been more than offset by price increases passed through to consumers. The graph below indicates quarterly corporate profits over the past 10 years. Second quarter 2021 corporate profits reached a record $2.7 trillion, surpassing the previous record of $2.4 trillion which was set in the first quarter of 2021. Corporate profits have increased approximately 30% from their pre-COVID highs in 2018.
Corporate Profits After Taxes (2011 Q2 – 2021 Q2)
Inflation Factors
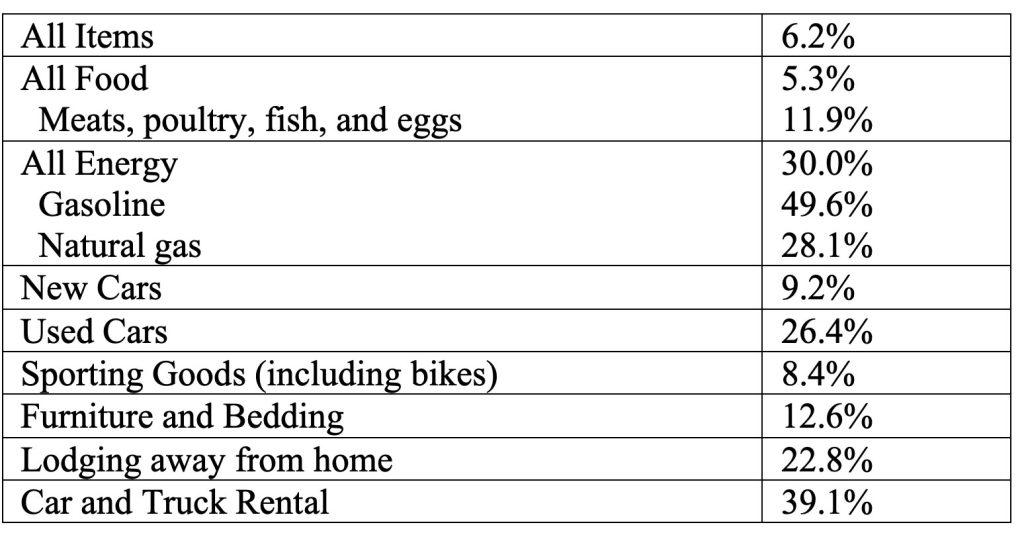
A myriad of factors contributed to the recent spike in U.S. inflation. COVID impacted the two broad factors that affect prices – supply and demand. Price increases have been broad, affecting a wide variety of consumer products. Listed below are the price increases for selected product categories that had some of the largest price increases for the 12 months ending October 2021.
12- Month Change in Prices – October 2020 to October 2021
While COVID was the driving force in creating demand and supply imbalances in not only the U.S. but also globally, COVID also magnified other issues that contributed to inflation. Although COVID was the driving force behind inflation, there wasn’t just one factor causing inflation. Depending on the product, price increases were caused by different factors.
Global Economic Recovery
On the demand side, COVID caused a global economic contraction in 2020. In 2021, it’s not just the U.S. economy that is recovering, it’s also the global economy. According to the International Monetary Fund (IMF), in late 2021 the global economic recovery continues amid a resurging pandemic with unique policy challenges. After declining 3.1% in 2020, global GDP is expected to increase 6.0% in 2022 and 4.9% on 2023. That dramatic reversal in economic growth increases the demand for products and services globally (including energy) and strains pandemic affected supply chains.
Energy Prices
The strong rebound in global economic growth contributed to a significant rise in energy prices. And when energy prices increase, prices of almost everything will increase. Almost everything you buy gets delivered by a truck. And it’s not just the United States facing increased energy costs, it’s global. According to the IMF, as of late October 2021, “spot prices for natural gas have more than quadrupled to record levels in Europe and Asia, and the persistence and global dimension of these price spikes are unprecedented”. Brent crude oil prices, the global benchmark, recently reached a seven-year high and quadrupled in 2021 relative to 2020. Overall, U.S. energy prices increased 30 percent between October 2020 and October 2021, with gasoline prices increasing 49.6% and natural gas increasing 28.1%.
2021 featured a global imbalance of demand and supply in the energy sector. The impact of COVID globally caused a collapse of energy consumption in 2020, leading energy companies to cut investments and supplies. However, consumption of natural gas rebounded fast with the global economy. Industrial production accounts for about 20 percent of final natural gas consumption, and the economic rebound boosted demand at a time when supplies were relatively low. Energy supply has also been impacted by weather, labor shortages, maintenance backlogs, and infrastructure issues.
Supply Chain
COVID also magnified other issues that contributed to inflation. World-wide demand for semiconductors grew significantly 2020 and 2021, as sales of consumer electronics ramped up and new technologies developed in the auto industry. However, the bulk of semiconductors are produced in Asia, including Taiwan, South Korea, China, and Vietnam. Supply chain issues, including the impact of COVID on the supply chain, contributed to a semiconductor shortage in 2021, particularly in the automotive industry. The shortage of semiconductors contributed to a stunning 26.4% increase in used car prices and 9.4% increase for new cars. According to the Semiconductor Industry Association, the U.S. share of global semiconductor manufacturing capacity has declined from 37% in 1990 to just 12% today. The drop in U.S. global semiconductor manufacturing capacity exacerbates COVID related sourcing problems.
In the United States, the ramp-up in consumer demand for imported goods as the economy expanded, combined with infrastructure problems at ports and railways, and labor shortages, contributed to supply chain problems. Imports of sporting goods, particularly bikes, and furniture are heavily relied on by U.S. consumers. Imports were impacted by COVID related supply chain issues not only in the U.S. but also in the foreign sourced country. Sporting goods prices (including bikes) increased 8.4% and furniture and bedding prices rose 12.6% for the 12-month period ended October 2021.
A myriad of factors contributed to a rise in food prices. Rising energy prices affect transportation and feed costs. COVID has created labor shortages which in turn affect product availability and supply chain issues. Unfavorable weather has also been a factor. For the 12-month period ended October 2021, food prices increased 5.3%, with meats, poultry, and fish up 11.9%.
Pent-Up Demand
Pent-up demand for travel and a COVID decline contributed to soaring prices in 2021 for lodging away from home, which saw a price increase of 22.8%, and car and truck rental prices, which increased 39.1%. Car and truck rental prices were also impacted by the semiconductor shortage, which impacted the prices and availability of new and used cars.
Although the demand and supply imbalances created by COVID that led to inflation are expected to subside, there will likely be some lasting effects. Inflation created by COVID magnified other problems, such as supply chain issues and offshore sourcing, infrastructure problems, labor market issues, global energy reliance on oil and natural gas, and in some cases, inventory management. Each of these areas has problems that although exacerbated by COVID, are not because of COVID. Changes will likely be made.
Conclusion
What a ride. Since early 2020, the COVID driven economy created unprecedented ups and downs in economic growth, employment, job openings, the quit rate, workers leaving the workforce, and inflation. Supply chain issues, including infrastructure problems and offshore sourcing, were not created by COVID, but the economic impacts of COVID magnified supply chain problems. Economic volatility began in 2020 with the dramatic, sudden negative economic impacts of COVID. Economic volatility continued as multiple fiscal and monetary responses reversed the negative economic effects of COVID, but new problems such as inflation and supply chain issues appeared in 2021. The uniqueness of the pandemic and unprecedented fiscal and monetary responses combined to create new challenges for businesses and policymakers.
As the U.S. and world get ready for 2022, the effects of COVID on the global economy continue. The greater the prevalence of COVID in 2022, the greater the negative economic effects. The impact of COVID was and remains global; countries are connected economically. Hopefully in 2022, the unprecedented economic volatility and negative effects caused by the virus dissipate. Supply chain issues should improve as the impact of COVID on global economies is reduced and infrastructure is improved. Demand and supply should become balanced as economic growth stabilizes and supply irregularities resolved, leading to reduced inflation and stabilization in the labor market. Some of the economic impacts of COVID will likely remain. Businesses may rethink supply chains and offshore sourcing. Infrastructure problems need to be resolved. Given the steep rise in energy prices, energy sourcing may be reconsidered. The labor market has changed, and increased flexibility and employment options for workers will likely remain in a growing economy. COVID created unprecedented economic challenges; meeting the challenges will allow the U.S. to emerge as a stronger global economic leader.
For further information:
- Info on historical inflation from the Federal Reserve Economic Database (FRED): FRED Database – Inflation
- Information on the recent CPI from the U.S. Bureau of Labor Statistics
- Info on product inflation from the U.S. Bureau of Labor Statistics
- Federal Reserve Economic Data (FRED) for oil prices:
- From the U.S. Energy Information Administration: Gas Prices
- From the U.S. Treasury: The Yield Curve
- From the Federal Reserve: Corporate Profits

Kevin Bahr is a professor emeritus of finance and chief analyst of the Center for Business and Economic Insight in the Sentry School of Business and Economics at the University of Wisconsin-Stevens Point.

CBEI Series: The U.S. Economy: Like Nothing That You’ve Seen
Part 1: Economic Growth
Part 2: Labor Market
Part 3: Inflation
