The Labor Market Overview
A collage of factors influenced the labor market in 2021, with some of those factors likely to continue impacting the labor market in 2022. The economic rebound of 2021 prompted a flurry of job openings; however, those job openings were not always filled, and talk of a “labor shortage” resulted. First, an overview of the labor market is presented followed by a discussion of factors affecting the labor market.
Employment
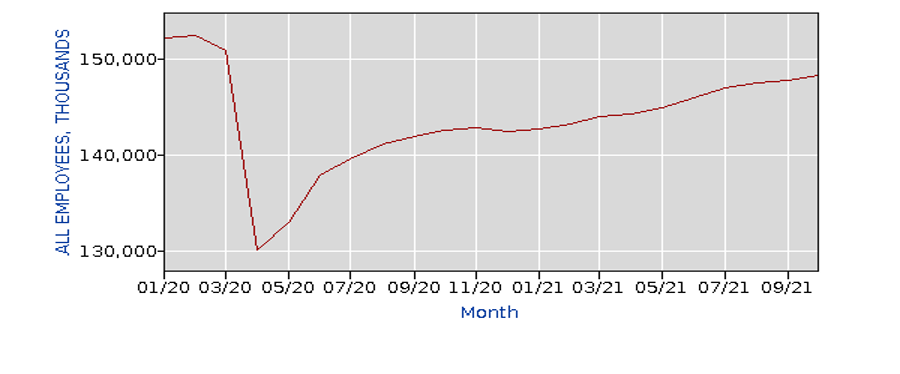
The chart below shows the roller coaster for U.S. employment from January 2020 through October 2021. Prior to the effects of COVID-19 on the economy, U.S. employment peaked at 152.5 million in February 2020. Two months later in April, employment dropped to 130.2 million. In two months, employment had declined by approximately 22.3 million jobs. 20.7 million jobs were lost in April; the magnitude of the job loss was unprecedented. It was most significant drop in monthly employment since the Bureau of Labor Statistics began tracking monthly changes in employment in 1939. Prior to 2020, the biggest drop in monthly employment was approximately 800,000 jobs in March 2009, almost 20 million less than the number of jobs lost in April 2020. Prior to the financial crisis, nonfarm employment peaked at 138.4 million in January 2008 before bottoming out at 129.7 million in February 2010. During the financial crisis, approximately 8.7 million jobs were lost over two years. During the COVID crisis in 2020, 22.3 million jobs were lost over two months.
Since May 2020, employment has consistently recovered. The June 2020 addition of 4.8 million jobs was the largest gain since the Bureau of Labor Statistics began tracking monthly changes in employment in 1939. Prior to 2020, the biggest increase in monthly employment was approximately 540,000 jobs in May 2010, over 4 million less than the number of jobs added in June 2020. In 2021, a resurgence of COVID contributed at least partially to a summer slowdown in employment growth. Between May and July approximately 1 million jobs were added to the U.S. economy. Between July and September, approximately 0.6 million jobs were added. However, employment growth increased strongly in October as 531,000 jobs were added, and employment reached 148.3 million. Since employment growth returned in May 2020, over 18 million jobs have been added back to the economy.
All Employees, nonfarm Payrolls (seasonally adjusted)
The Unemployment Rate
Changes in the unemployment rate over the course of the business cycle in normal times typically occur gradually, often characterized by persistence and momentum. Persistence means the variable will slowly gravitate to a historical average; momentum means the variable will continually move in the same direction for a period of time. Neither happened in 2020. The unemployment rate was volatile, moving significantly, rapidly, and in opposite directions.
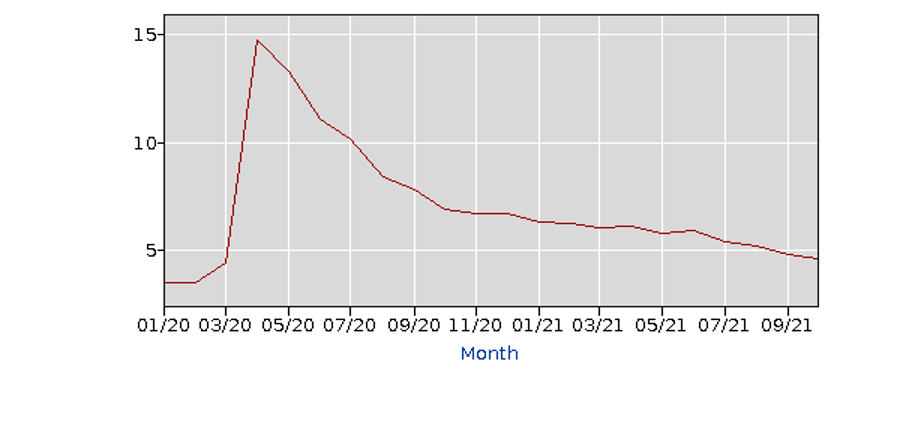
The chart below shows the U.S. unemployment rate since January 2020. The onset of COVID in 2020 caused the unemployment rate to skyrocket from a pre-COVID low of 3.5% in February 2020 to a peak of 14.8% in April, a two-month increase of 11.3%. The 10.4% increase that occurred in April was the largest monthly increase based on available Bureau of Labor Statistics data since 1948. Prior to 2020, the largest monthly increase in the unemployment rate was only 0.7% in April 1958. During the COVID crisis in 2020, the unemployment rate increased 11.3% over two-months. During the financial crisis, the unemployment rate increased 5.6% over 29 months, from a 2007 low of 4.4% in May to a peak of 10.0% in October 2009.
Beginning in May 2020, the unemployment rate began a consistent downward trend and reached 6.7% by year end. Strong job gains in October 2021 led to a further drop in the unemployment rate to 4.6%. In approximately a year and a half, the unemployment rate declined over 10%. The 8.1% drop that occurred in the unemployment rate from April through December 2020 was unprecedented. Prior to 2020, the largest drop in the unemployment rate that occurred during a given year was 2.1% in 1983.
Although the overall unemployment rate has declined, differences in rates remain for major worker groups. The unemployment rate in October was 4.3 percent for adult men, 4.4 percent for adult women, and 11.9 percent for adult teenagers. The unemployment rate was 4.0 percent for Whites, 7.9 percent for Blacks, 4.2 percent for Asians, and 5.9 percent for Hispanics. In 2020, the unemployment rate for persons with a disability continued to be much higher than the rate for those without a disability, rising to 12.6 percent. In addition to employment challenges, unfortunately Social Security rules are restrictive and significantly limit the amount of income and assets that a disabled person may have. Exceeding those limits means risking losing benefits – including healthcare. Even part-time employment could cause a disabled person to lose Social Security benefits, despite an employer not offering health insurance.
Unemployment Rate (16 yrs. and older)
The Labor Market and “Labor Shortage”
Employment growth and the decline in the unemployment rate have been extensive since April 2020 when the negative impacts of COVID on the economy peaked. Although employment growth has been significant, there were still approximately 4 million fewer employed in October 2021 than in February 2020. Despite the decrease in employment, “labor shortages” have been discussed as many businesses have not been able to hire desired employees. Next, a discussion of factors potentially affecting the labor market and “labor shortages”.
Extended Unemployment Benefits
In March 2020 the Coronavirus Aid, Relief, and Economic Security (CARES) Act was passed by Congress and became law. The CARES Act established the Federal Pandemic Unemployment Compensation program, which provided an additional $600 per week to individuals who were collecting regular unemployment insurance benefits. The additional $600 payment ended in July 2020, but in January 2021 the program was partially reinstated, with an additional $300 payment that was scheduled to end in March 2021. The American Rescue Plan, passed in March 2021, extended federal unemployment programs, including the $300 additional payment, through September 4, 2021. However, states could opt out of the extended benefit program. In an attempt to incentivize workers to return to work, 26 states ended the federal benefit before September, with 22 states ending the program in June.
Did ending the benefits early prompt a flood of workers to return to work? No, according to multiple studies. “Early Withdrawal of Pandemic Unemployment Insurance: Effects on Earnings, Employment and Consumption” from a team of economists and researchers at Columbia University (K. Coombs and S. Naidu), Harvard University (C. Janke and R. Kluender), the University of Massachusetts Amherst (A. Dube), and the University of Toronto (M. Stepner) concluded that ending the unemployment benefits early provided only a relatively small increase in employment relative to states that did not end benefits. However, the resulting decrease in consumer spending that resulted from 7 out of 8 people not finding employment caused a drastic decline in consumer spending and lowered state economic growth from what would have occurred if benefits did not end. The bottom line – ending the unemployment benefits early did not result in a significant return to work for the unemployed.
UKG, a payroll and time management firm, compared data of states that ended unemployment benefits early relative to states that did not end benefits. The UKG data showed that states ending additional federal unemployment benefits grew workforce activity among hourly employees at a lower rate of growth relative to states that continued the additional benefit. The extension of unemployment benefits was not the primary reason that people did not return to the workforce.
Job Openings
As the economy recovered in 2021, the number of U.S. job openings skyrocketed.
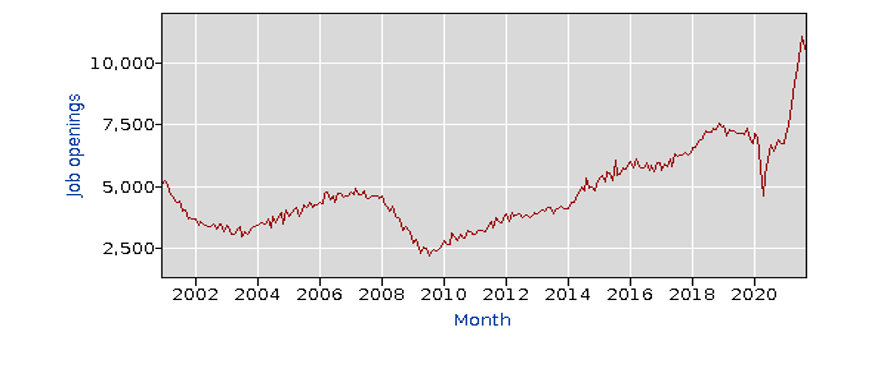
The chart below shows the number of U.S. monthly job openings since 2000. Looking at the number of U.S. monthly job openings since 2000 provides a picture of how significant the number of job openings has been recently. Prior to 2014, the number of monthly job openings was generally below 5 million. Following the end of the financial crisis in 2009 an expanding economy contributed to monthly job openings gradually increasing from approximately 2.2 million in July 2009 to a pre-COVID peak of nearly 7.6 million in October 2018. As economic growth slowed in 2019 the number of monthly job openings declined consistently to a yearly low of 6.7 million in December. The number of monthly openings dropped precipitously in early 2020 due to COVID to a low of 4.6 million in April 2020 before increasing later in the year. By December 2020, the number job openings was approximately equal to the number of job openings one year earlier. The number of job openings had increased by over 2 million from a COVID low of 4.6 million in April 2020 to over 6.7 million in December.
However, in 2021 the number of monthly job openings exploded to record levels. The number of job openings in July 2021 was slightly greater than 11.0 million, an increase of 4.3 million job openings (64%) from the December 2020 level. Although the number of job openings slightly declined after July, the number of job openings remained strong. The number of job openings totaled just under 10.5 million in September, down from the record high 11.0 million in July. This compares to a pre-COVID high of 7.6 million job openings in November 2018.
U.S. Monthly Job Openings 2000 through September 2021 (thousands)
The record level of job openings contributed to the “labor shortage”. The number was more than twice the level of job openings that occurred in any year between 2000 and 2014, and approximately 40% greater than the peak of job openings that occurred during 2018 before the pandemic.
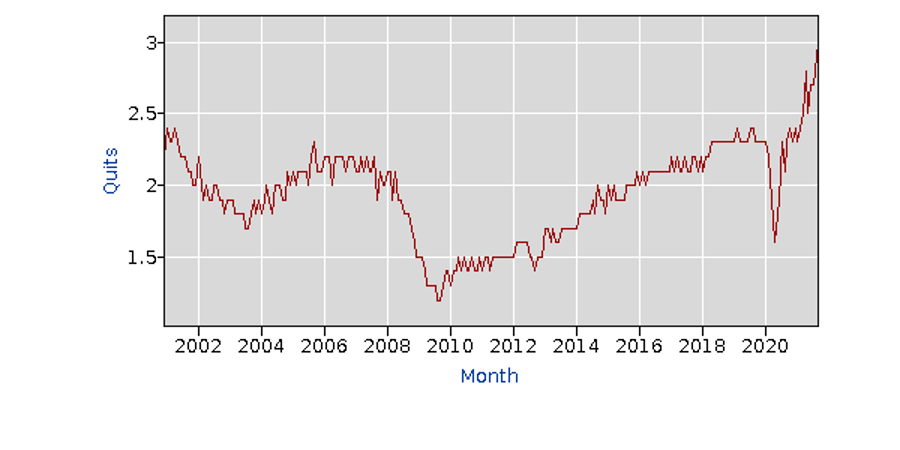
The Quit Rate
Record levels of job openings? “Hold my beer” replies the 2021 quit rate. The graph below shows the quit rate for the United States since the turn of the century through September 2021. The quit rate is the number of people quitting jobs during the entire month as a percent of total employment. That rate reached a record high 3.0% in September 2021. For seven consecutive months, from March 2021 through September 2021, the quit rate was higher than any month this century prior to March 2021. More Americans had it with their job and called it quits in 2021 than at any other time.
There were likely a myriad of factors contributing to the high quit rate, including:
- Job Openings. The record number of job openings meant that employees could quit and reassess their job, career, and work environment and likely find a job when they decided to return to work.
- Wages. Want a raise? Average hourly earnings have increased by 4.9 percent for the 12-month period ending October 31, 2021. Although wages have generally increased, in some cases getting a raise was easier by quitting than staying in the same job. In some occupations, new hires could get paid more than employees with more experience.
- COVID resurgence. The summer resurgence of COVID meant some workers faced an increased risk of contracting the virus if they remained in their current job, either from customers or coworkers.
- Job stress or work conditions. Certainly, many workers experience job stress, but arguably health care workers led the way in dealing with significantly more of it since the onslaught of COVID.
- Unruly customer behavior. Unfortunately, not all jobs and occupations receive the respect they deserve. From retail, to healthcare, to education, job incidents increased. Airlines provide an unfortunate example. Through early November, the Federal Aviation Administration indicated that the number of investigations initiated regarding unruly passenger behavior was more than twice the level of any previous year.
The Quit Rate
No doubt the number of employees quitting contributed to the hiring woes of employers. The industries with the top two quit rates in August and September 1) Leisure and hospitality (including food service), and 2) Retail trade. Generally, relatively low paid, high customer contact positions.
Workers Not in the Labor Force
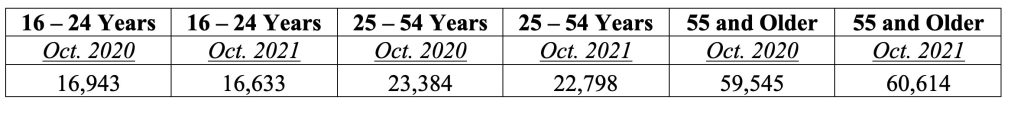
The table below compares the number of workers by age that opted to stay out of the workforce in October 2021 relative to October 2020. Who’s not going back to work despite the record level of job openings? Older Americans. The number of workers opting to stay out of the workforce for workers aged 16 – 24 years and 25 – 54 years decreased for both groups. However, the number of workers opting to stay out of the work force increased by over 1 million for workers aged 55 and older. Will older workers rejoin the work force? Maybe, but early retirement might look pretty good – particularly given recent stock market returns.
Workers Not in the Work Force by Age (in thousands)
Stock Market Returns
For those workers with money invested in the stock market (including retirement funds), things have been looking pretty good.
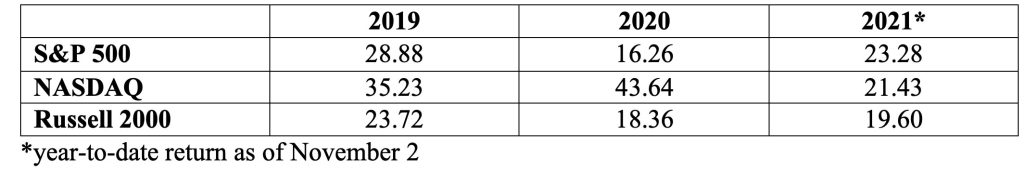
The table below shows the quarterly returns of three major U.S. stock indexes: 1) the S&P 500 – a diversified index that measures the stock performance of 500 relatively large companies (it is a “large-cap” index, generally comprised of companies having a total stock value exceeding $10 billion), 2) the NASDAQ – an index comprised of over 3000 companies listed on the NASDAQ stock exchange and heavily weighted toward technology, and 3) the Russell 2000 – a diversified index that measures the stock performance of 2000 relatively small companies (it is a “small-cap” index, generally comprised of companies having a total stock value less than $2 billion). For comparative purposes, the long-run average annual return (since 1926) is approximately 12 percent on large-cap stocks and 16 percent on small-cap stocks.
Since 2019, stock market returns have generally been excellent. Even in 2020, when all three indexes significantly declined in the first quarter due to the onset of COVID, the stock market began looking forward to a post-COVID recovery. For the full year, the S&P 500 increased 16.26 percent and the Russell 2000 was up 18.36 percent, both higher than their historical average annual return. The NASDAQ increased an amazing 43.64 percent. Through early November 2021, the year-to-date returns once again remain strong, with each index increasing approximately 20%. Certainly, there have been ups and downs, but generally the market has been looking forward with an expectation for sound economic growth.
U.S. Stock Market Returns
For workers invested in the stock market, that strong performance has provided some financial flexibility through increased investment account balances, which in turn can affect the work decision.
Summary
The labor market and “labor shortages” have been impacted by a myriad of factors. The labor market remains strong since it started recovering from the initial impacts of COVID in early 2020 as consistent economic growth has returned. Job openings increased significantly in 2021. However, many businesses faced challenges in trying to hire desired employees. Quit rates were at record levels in 2021 due to a variety of factors, including a resurgence in COVID, the desire to avoid dealing with unruly customers, employees reassessing careers, job stress and work conditions, the relative ease of finding a new job, and the increased possibility of getting a raise if switching jobs or careers. Many Americans, particularly older Americans (age 55 and older), have remained out of the labor force. The decision to not return to the workforce has been bolstered by the superior investment returns offered by the stock market since 2019.
“Labor shortages” may decrease but not end in 2022. An expanding rather than rebounding economy should decrease the volatility in job openings. Wages have increased offering greater incentives for workers. However, certain trends in the labor market may not dissipate the “labor shortages”. Quit rates have increased as workers have reassessed career options and older workers have left the workforce. COVID has waned but has not ended. Impacts on the workforce will remain until it is eradicated. The post-COVID employment world may result in workers desiring and demanding greater job flexibility. Structurally within the labor market, changes could help alleviate some of the shortages. Increased wages, greater job flexibility, proper staffing to avoid job stress, and improved work environments would all contribute to greater worker satisfaction. In addition, regulatory changes could improve job market opportunities for people with disabilities. “Labor shortages” create challenges; a continually changing and evolving labor market will require necessitated changes.
For further information:
- Info from the Bureau of Labor Statistics:
- K. Coombs, A. Dube, C. Jahnke. R. Kluender, S. Naidu, M. Stepner, “Early Withdrawal of Pandemic Unemployment Insurance: Effects on Earnings, Employment and Consumption,” Working Paper, August 2021, https://files.michaelstepner.com/pandemicUIexpiration-paper.pdf.
- Info from UKG: UKG Workforce Activity Report
- From Morningstar, info on S&P 500 performance and the financial markets: S&P 500 Returns

Kevin Bahr is a professor emeritus of finance and chief analyst of the Center for Business and Economic Insight in the Sentry School of Business and Economics at the University of Wisconsin-Stevens Point.
CBEI Series: The U.S. Economy: Like Nothing That You’ve Seen
Part 1: Economic Growth
Part 2: Labor Market
Part 3: Inflation