Inflation has been a relatively hot topic of discussion with the annualized inflation rate hitting 7.5% in January, the highest rate since the early 1980s. Inflationary pressures resulted from a combination of increased demand as the economy rebounded from COVID, and reduced supply because of COVID related supply chain issues. This blog will look at inflation from a long-run perspective. How has globalization impacted U.S. inflation? Given COVID disrupted supply chains, what can we expect in the future?
Inflation and Globalization
There are two economic forces that affect prices – supply and demand. Generally, inflation is caused when there is a change to one of these forces. If the supply of goods is reduced for a given demand, prices (inflation) will increase until a higher price level is reached that balances the demand to match the reduced supply. If the demand for goods is increased for a given supply, prices (inflation) will increase until a higher price level is reached that balances the supply of goods to match the increased demand. On the demand side, factors that affect inflation include changes in consumer demand (which is strongly tied to economic growth and the unemployment rate), business spending, and government spending. Interest rates can significantly affect consumer and business spending. On the supply side, factors that affect inflation include changes in the cost and availability of goods and services. One factor affecting the cost and availability of goods and services is globalization.
The red line in Chart 1 below shows the annual rate of U.S. inflation since 1970. The blue line shows the dollar value of U.S. imports of goods and services since 1970.
Chart 1: U.S. Inflation Rate and Imports of Goods and Services 1970-2020
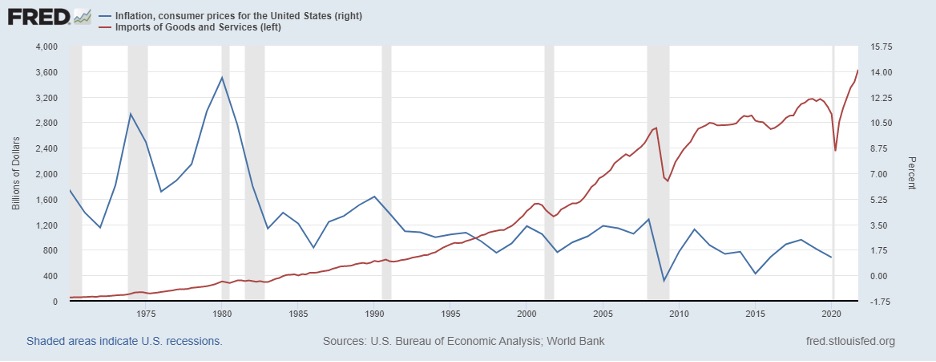
Globalization, as reflected by the volume of U.S. imports and services, began ramping up in the 1980s. Imports doubled in the 1980s, from $294 billion in 1980 to $591 billion in 1989. Imports doubled again in the 1990s, from $630 billion in 1990 to $1.25 trillion in 1999. The trend continued after the turn of the century, with imports increasing from $1.48 trillion in 2000 to $2.58 trillion in 2008, before the global economy collapsed due to the financial crisis. The last decade saw the longest economic expansion in the history of the U.S. and included an increase of imports from a recession low of $2.0 trillion in 2009 to $3.12 trillion in 2019 before the 2020 global economic contraction caused by COVID. The 2021 economic rebound saw imports climb to nearly $3.4 trillion, a record high. The increase in imports between 1980 and 2021 equates to a compounded annual growth rate of 6.1%. The growth rate of imports has exceeded the U.S. economic growth rate. Between 1980 and 2021, U.S. GDP grew from $2.857 trillion to $22.993 trillion, a compounded annual growth rate of 5.2%.
After peaking at 13.5% in 1980, the average annual inflation rate generally declined until a rebound late in the 1980s. In 1990, inflation rose to 5.4% and in 1991 declined slightly to 4.2%. Between 1992 and 2020, inflation never exceeded 4.0% and exceeded 3.0% in only six years. Since the early 1990s inflation has been relatively low. After 1992, the annual inflation rate did not exceed 4% until 2021, when it ended the year at 7%. A contributing factor to low inflation has been globalization, as demonstrated by the volume of U.S. imports of goods and services.
Since the 1980s, global supply chain networks have evolved for many companies and industries. Companies can source inputs and products globally to minimize costs, maximize profits, and expand markets. The minimization of costs through globalization has contributed to a relatively low, sustained long-term inflation rate, particularly since the early 1990s, and particularly in manufacturing. The Conference Board estimated that in 1997 hourly compensation costs in manufacturing for Mexico were only 11% of what they were in the United States. In 2016, hourly compensation costs in manufacturing for Mexico were only 10% of what they were in the United States. Hourly compensation costs in manufacturing for China were estimated at less than 5% of U.S. costs until 2009 but were still only 11% of U.S. costs in 2013. The bottom line – low-cost sourcing options for companies contributed to low inflation for consumers.
Globalization and Supply Chains
COVID introduced never before seen supply chain interruptions and highlighted how these interruptions can negatively impact businesses, cause product shortages, and contribute to increased inflation for consumers. U.S. firms relying on foreign sourced inputs or products were particularly vulnerable to supply chain disruptions. Although cost had been a primary factor in considering foreign sourcing, COVID introduced a new factor to consider – product availability.
Globalization, as reflected by the volume of U.S. imports of goods and services, contributed to sustained, relatively low inflation particularly since 1990. However, it also contributed to a decline in manufacturing employment, which has particular consequences when products are foreign sourced and supply chains are interrupted.
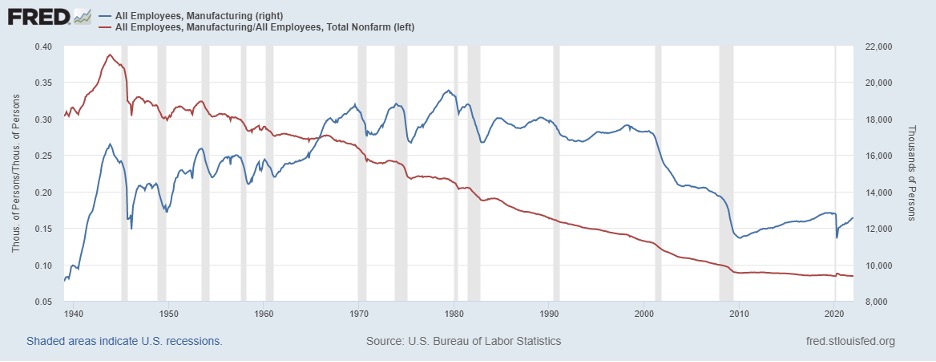
The blue line in Chart 2 below indicates the number of employees in manufacturing from 1939 through 2021. The red line indicates the number of employees in manufacturing divided by total non-farm employment from 1939 through 2021 – the percentage of people employed in the manufacturing sector.
From 1939 through 1979 the number of people employed in the manufacturing sector generally increased, from a level of 9.3 million in 1939 to a peak of 19.5 million in 1979. Globalization, as reflected by the volume of U.S. imports of goods and services, began ramping up in the 1980s. That contributed to a downward trend in manufacturing employment that began in 1980. Although manufacturing employment rebounded slightly in the 1990s, the downward trend returned after the turn of the century with a sharp decline that generally continued through early 2010. After hitting a low of 11.5 million in early 2010, manufacturing employment generally grew each year throughout the entire decade, with only 2016 and 2019 having relatively unchanged manufacturing employment. Despite the growth in manufacturing employment during the economic expansion, the manufacturing sector ended the decade with almost 1 million fewer employees than what it had before the financial crisis. Manufacturing employment was 12.9 million in December 2019 before COVID, almost a 40% drop from the peak employment in 1979 and a 6.5% drop from the October 2007 level of 13.8 million.
As a percent of total employment, manufacturing employment peaked during World War II in October 1943 at 38.9%. However, after peaking in 1943, the percentage of people employed in the manufacturing sector has generally been on a long and steady decline. By early 1980, manufacturing employment comprised slightly more than 21% of total employment. The recent decade began with manufacturing employment comprising 8.8% of total employment; the decade ended with manufacturing employment comprising only 8.5% of total employment. That compares to manufacturing employment comprising 13.8% of total employment in October 2007, before the economic downturn caused by the financial crisis. Economic growth, significant corporate tax breaks from the 2018 tax bill, and tariffs and trade wars could not return manufacturing employment to the pre-financial crisis levels of 2007.
The United States began a tariff and trade war with China (and other countries) in 2018 that continued into 2019. Despite the implementation of significant tariffs with the goal of returning jobs to the U.S., manufacturing employment in the U.S. remained relatively unchanged at 12.8 million in 2019. A key benefactor of that trade war with China was Vietnam. U.S. corporations wanting to avoid paying the tariffs on Chinese sourced products looked elsewhere for sourcing. Although merchandise imports from China declined in 2019, merchandise imports from Vietnam exploded. Merchandise imports from Vietnam began the last decade at $14.8 billion and grew to $49.2 billion in 2018. However, in 2019 imports from Vietnam grew 34.6% to a record high of $66.6 billion, an increase of over $17 billion from 2018. In 2021, merchandise imports from Vietnam were just under $102 billion, twice the level of 2018. In other words, increasing costs to U.S. corporations through tariffs on Chinese goods did not significantly return jobs to the U.S. Instead, in many instances U.S. corporations pursued alternative low-cost sourcing options, like Vietnam.
Chart 2: Manufacturing Employment and Manufacturing Employment as Percentage of Total Employment 1970-2021
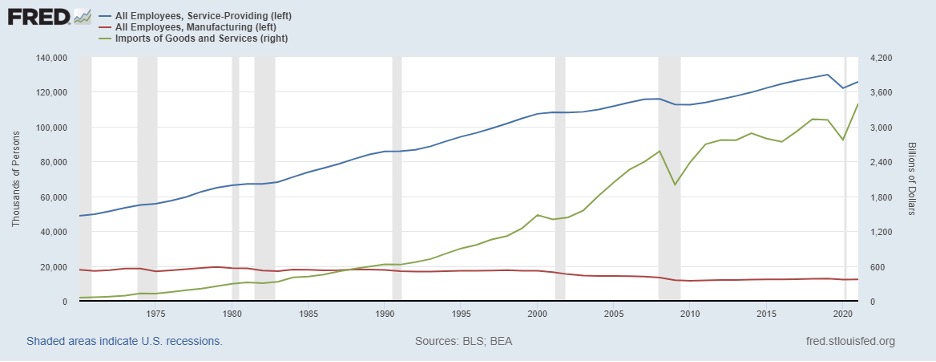
Globalization contributed to a shifting of employment in the U.S., from the manufacturing sector to the service sector. Chart 3 shows service provider employment (blue line), manufacturing employment (red line) and imports of goods and services (green line) from 1970 through 2021. Similar to imports, total employment generally consistently grew over the entire period. When U.S. manufacturing employment peaked at 19.5 million in 1979, total employment was nearly 90 million. By 2021, manufacturing employment had declined nearly 40% to 12.3 million while total employment increased by approximately 60% to 146 million. Low-cost foreign sourcing of products contributed to a reduction in manufacturing employment but also contributed to an increase in service sector jobs.
Chart 3: Service Employment, Manufacturing Employment and Imports of Goods and Services (1970-2021)
The Future
COVID provoked unprecedented supply chain disruptions and has caused many companies to rethink supply chains and foreign sourcing. However, there was a reason why supply chains were set-up the way they were in the first place. Companies could source inputs and products globally to minimize costs, maximize profits, and expand markets. In many instances, foreign sourcing lowered costs for corporations and prices to U.S. consumers. In the 1980s, just-in-time inventory management grew in popularity, which featured receiving inputs when they are needed for the production process rather than stockpiling needed goods. Just-in-time inventory management reduced costs, but increased exposure to any potential supply chain disruptions. COVID disrupted supply chains and foreign sourcing, which led to product shortages, increased costs for firms, and increased prices for consumers.
COVID driven supply chain interruptions and inflation are a global problem. According to the Organisation for Economic Co-operation and Development, the annual inflation rate for the Euro area was 5.0% in December. Greece, Germany, Ireland, Belgium, the Netherlands, and Spain all had annual inflation rates exceeding 5.0%.
Exactly how and if companies significantly change supply chains only time will tell. Although lower costs were an incentive for foreign sourcing, an important consideration since COVID is product availability. Just-in-time inventory management may be transformed to just-in-case inventory management, at a cost. Just-in-case inventory management features alternative and/or multiple sourcing options, and a greater focus on customer relationship management. Increasing U.S. sourcing could limit supply chain interruptions but would not be without challenges. Absent COVID related supply issues, changing a supply chain to focus on U.S. rather that foreign sourcing could increase costs relative to the foreign sourcing, and subsequently prices to consumers, unless a company is willing to absorb the increased costs However, the benefit of U.S. sourcing could outweigh the potential costs of any future supply chain disruptions. Certainly there are other factors that affect profitability and pricing, such as automation and productivity, but again, there is a reason why supply chains were initially set-up the way they were.
There are also labor market challenges for shifting supply chains back to the U.S., as the job market was strong pre-COVID and the job market has strongly rebounded with the economic recovery. Despite the general decline in manufacturing employment, the pre-COVID peak in total U.S. employment was 152.5 million in February 2020 with a pre-COVID unemployment rate low of 3.5%. After employment dropped to only 130.2 million in April 2020 and unemployment skyrocketed to 14.8%, the economy and job market have strongly recovered. In January 2022, the unemployment rate was 4.0% and employment rebounded to nearly 150 million. Although there remains room for the labor market to grow, pre-COVID employment was strong with a low unemployment rate and the economic rebound since early 2020 has created strong employment with a low unemployment rate. The challenge will be to create an increasingly attractive labor market for all potential employees.
Ultimately, it is up to U.S. firms where to source inputs and products, and up to U.S. consumers what products to buy. COVID has caused many firms to rethink supply chains and sourcing; ultimately, U.S. corporations and consumers will decide what actually changes.
For further information:
- Info on inflation from the Federal Reserve Economic Database (FRED): FRED Database – Inflation
- From the Conference Board, info on international manufacturing costs: International Compensation on Hourly Compensation Costs in Manufacturing
- Info from the Bureau of Labor Statistics:
- Historical import and net export info from the Federal Reserve Economic Database (FRED):
- Info on trade from TradeStats Express
- From the U.S. Census Bureau – U.S Top Trading Partners – Exports, Imports, Surpluses, Deficits: Foreign Trade – U.S. Trade
- From the Organisation for Economic Co-operation and Development (OECD): Global Inflation

Kevin Bahr is a professor emeritus of finance and chief analyst of the Center for Business and Economic Insight in the Sentry School of Business and Economics at the University of Wisconsin-Stevens Point.