
Over the last three decades, the United States enjoyed positive economic growth in 27 out of 30 years. How did economic growth affect wages? Did everyone benefit? Not really. In 2019 the Congressional Research Service (CRS) released an analysis of real wage trends over the period 1979–2018. The Congressional Research Service is part of the Library of Congress and works exclusively for the United States Congress, with the goal of providing nonpartisan analysis on relevant policy issues and legal analysis to Congress. The CRS report uses data collected from the Current Population Survey, a nationally representative sample of workers, to estimate real hourly wages at the 10th, 50th and 90th income percentiles, and analyzes how real wages changed over time. Percentiles allow analyzing different income segments of the working population – workers at the 90th percentile have higher real hourly wages than 90% of workers.
Table 1 below is taken from that analysis and shows how real hourly wages changed between 1979 and 2018 across selected demographic characteristics for three different income levels. The change in real hourly wages was analyzed for workers at the 10th, 50th and 90th income percentiles across varying demographic characteristics. In each case the graphs within the table show the dollar change in real hourly wages over this time period. The vertical axis of each chart shows the change in real hourly wages (with a range between $0 and $65); the horizontal axis shows the period 1979 through 2018.
Overall, workers at the 90th income percentile enjoyed the greatest change, with the hourly real wage increasing 37.6% from approximately $38.44 to $52.88 (2018 dollars). Workers at the 50th percentile (the median) had only a 6.1% increase in real wages; for workers at the 10th percentile not much changed, only a 1.6% increase. Men in the 90th income percentile had a 36.4% increase in real wages compared to 66.7% for women. At the 50th percentile, men had a decrease of 5.1% compared to gains of 25.7% for women. At the 10th percentile, men had a decrease of 13.3% to gains of 4.1% for women. The data indicate a lessening, but certainly not a complete closing, of the income gap between men and women. The median wage of women was still only about 80% of the median wage of men in 2018.
Across ethnic differences, Whites had the greatest gains at each percentile, registering gains of 45.6%, 13.2%, and 8.2% for the 90th, 50th and 10th percentiles, respectively. Gains for Blacks and Hispanics were much less (if at all). At the 90th percentile, Blacks and Hispanics had increases of 28.5% and 11.4% respectively. At the 50th percentile, Blacks had an increase of 1.2% while Hispanics saw a decline of 4.6%. Both groups had declines in real wages at the 10th percentile, with Blacks having a 0.3% decrease and Hispanics a decline of 3.7%.
Summarizing, the key findings of the report included:
- Real wages rose significantly at the top of the income distribution (37.6%) compared to real wages at the middle (6.1%) and bottom of the distribution (1.6%).
- Real wages rose at the 90th percentile for every category. Real wages at the 50th and 10th percentiles generally showed little growth or declined across most categories.
- The median real wage (50th percentile) increased only 6.1% between 1979 and 2018, from approximately $20.76 to $22.00 (2018 dollars).
- From 1979 to 2018, the gender wage gap narrowed but did not close. The median wage for women was still only approximately 80% of the median wage for men in 2018. Wage gaps expanded across ethnic differences, as gains for Whites by far outpaced the gains of Blacks and Hispanics.
Table 1 – Real Wage Trends 1979-2018, by Selected Demographic Characteristics
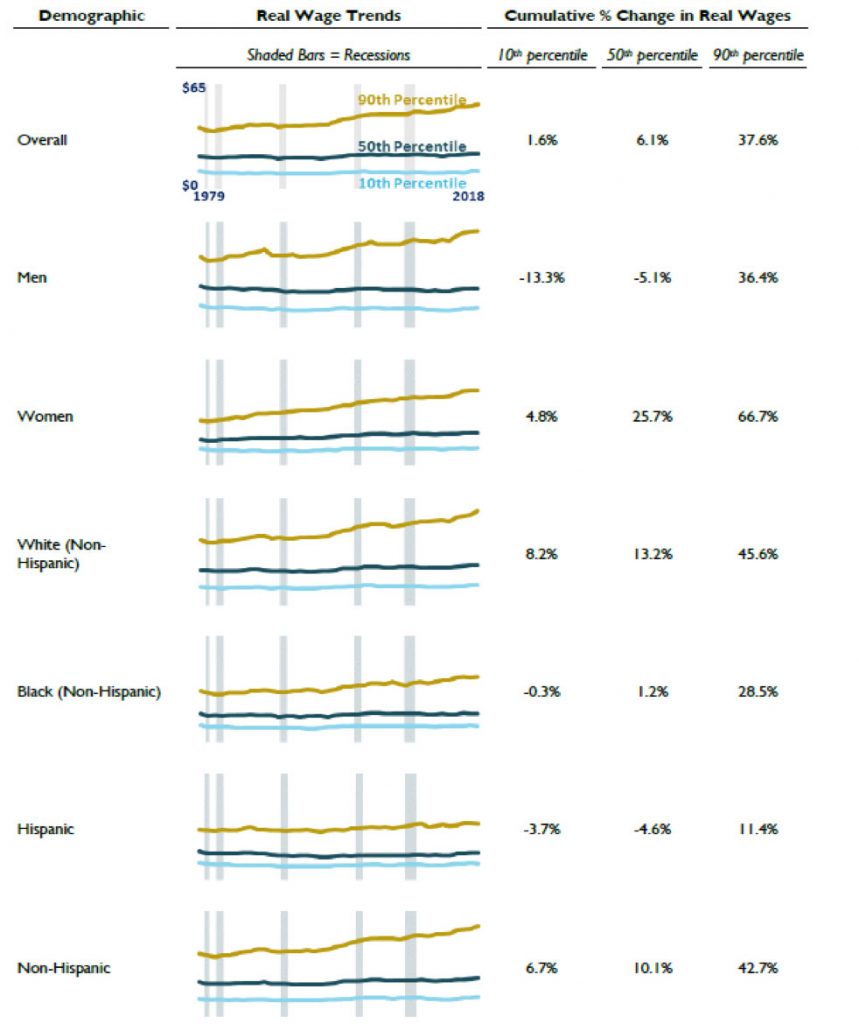
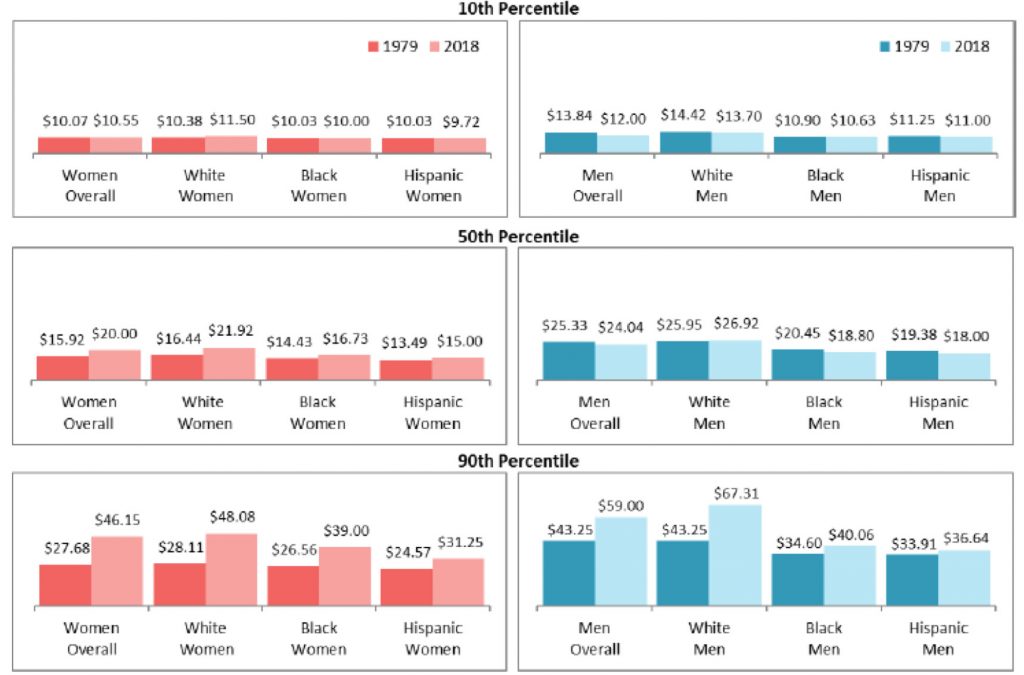
Table 2 below provides more detail on how real hourly wages changed over the period 1979–2018. Wages at the 10th, 50th and 90th percentile are given by sex, race and ethnicity for 1979 and 2018. The 1979 wages are adjusted for inflation by the Consumer Price Index for All Urban Consumers (CPI-U), which measures the change in the price of a basket of goods and services purchased by urban consumers.
At the 10th percentile, only White women saw real hourly wages increase – every other demographic had a decline. White women had an increase of $1.12, Black women saw a decline of $0.03, and Hispanic women had a decline of $0.31. For men, the decreases for Whites, Blacks and Hispanics were $0.72, $0.27 and $0.25, respectively. At the 50th percentile, real hourly wages increased for women across all demographics. White women had an increase of $5.48, Black women $2.30, and Hispanic women $1.51. At the 50th percentile, real hourly wages increased for White men by $1.97, while wages decreased for Black and Hispanic men by $1.65 and $1.38, respectively. At the 90th percentile, real hourly wages increased across all demographics, and the increases were significantly greater than increases at the 50th percentile. For women, the increases for Whites, Blacks and Hispanics were $19.97, $12.54 and $6.68, respectively. For men, the increases for Whites, Blacks and Hispanics were $24.06, $5.46 and $2.73, respectively.
The gender gap lessened but remains – at the 10th percentile women made $10.55 (in 2018 dollars) vs. $12.00 for men; at the 50th percentile, women made $20.00 vs. $24.04 for men; at the 90th percentile, women made $46.15 vs. $59.00 for men. At each percentile, White women and White men had the highest real hourly wage for both 1979 and 2018. Ethnic gaps expanded. Gains for Whites by far outpaced the gains of Blacks and Hispanics for both men and women.
Table 2 – Wages at Selected Percentiles, by Sex, Race and Ethnicity 1979–2018
(Wages in 2018 dollars)
The future challenge for policy makers – expand the financial benefits of any economic growth across a broad range of demographic differences.
For further information:
- Congressional Research Service, Real Wage Trends 1979–2018: CRS Real Wage Trends
CBEI Series: Divisiveness and the Economic Challenges of 2021
Challenge #1: COVID-19 and the 2021 Economy
Challenge #2: Controlling U.S. Debt and Federal Budget Deficits
Challenge #3: Manufacturing and Trade
Challenge #4: Healthcare
Challenge #5: U.S. Economic Leadership
Challenge #6: Wages

Kevin Bahr is a professor emeritus of finance and chief analyst of the Center for Business and Economic Insight in the Sentry School of Business and Economics at the University of Wisconsin-Stevens Point.