
Let’s continue with our Divisiveness and the Economic Challenges of 2021 series with Challenge #2 – Controlling U.S. Debt and Federal Budget Deficits.
The Federal Deficit
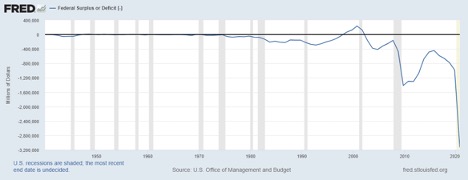
The federal budget deficit refers to U.S. federal government spending exceeding government income. The necessity of the $2 trillion Covid-19 stimulus contributed to a record federal budget deficit for fiscal year 2020 (year ended September). The graph below puts some historical perspective on the current deficit relative to previous years. The graph shows the U.S. federal budget surplus or deficit since 1940. The shaded areas of the graph indicate an economic recession.
For fiscal year 2020 the deficit topped $3.1 trillion, more than double the $1.4 trillion deficit that resulted in 2009 from the financial crisis. Federal budget deficits didn’t really start appearing on a regular basis until the 1970s, with the deficit increasing through the first half of the 1980s. Generally, an expanding economy leads to a decrease in the U.S. federal government budget deficit as tax revenues increase. The economic expansion in the 1980s led to the deficit declining slightly in the late 1980s, and the strong economic expansion in the 1990s led to budget surpluses. Following the recession of the early 2000s and the financial and economic crisis of the late 2000s, the deficit once again was reduced. However, the tax cuts of 2018 contributed to a growing budget deficit, and the 2020 stimulus brought the deficit to record levels.
Federal Budget Surplus or Deficit
Annual amount of Federal Budget Surplus or Deficit in Millions of Dollars (1/1/40-9/30/20)
Federal Debt
To finance a budget deficit the U.S. government borrows money from the public through the issuance of U.S. government debt securities called U.S. Treasury securities. Buyers include individuals, institutional investors, certain mutual funds, and foreign investors and governments. Regarding the foreign investors, Japan and China are by far and away the major foreign investors in U.S. Treasury securities. As of August 2020, Japan owned nearly $1.3 trillion of U.S. Treasury securities while China owned nearly $1.1 trillion. Japan’s holdings accounted for approximately 18% of the Treasury debt held by foreign investors while China accounted for approximately 15%.
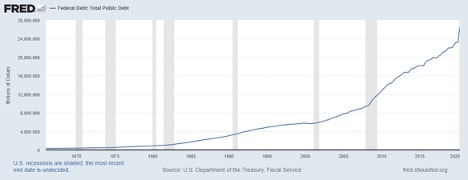
The graph below puts some historical perspective on the current deficit relative to previous years. The graph shows the total federal debt held by the public. From 2000 to 2009, the federal debt approximately doubled, from approximately $5.8 trillion to $12.3 trillion. In the past decade, the federal debt level nearly doubled again, from $12.8 trillion in 2010 to over $23.2 trillion in the further quarter of 2019. In 2020, a spike in the debt level occurred. By the end of the second quarter in 2020, debt approached $26.5 trillion, a 14% increase relative to the fourth quarter of 2019.
Federal Debt: Total Public Debt
Amount of Federal Debt in Millions of Dollars (1966-2020 2nd qtr.)
Federal Debt and Income
To better gauge the magnitude of federal debt outstanding, the amount of federal debt outstanding is often compared to the Gross Domestic Product (GDP). GDP not only measures output in the economy, it also reflects income. When goods and services are created, income is also created, split between individuals, corporations, and the government. Federal debt as a percentage of GDP is a measure of a country’s ability to pay its debt. If you have $100,000 of debt is it a lot? The answer is probably yes if your income is $50,000; the answer is probably no if your income is $50,000,000. The more income, the more debt you can generally financially afford. Federal debt as a percentage of GDP provides a relative measure as to how the federal debt financially burdens the country.
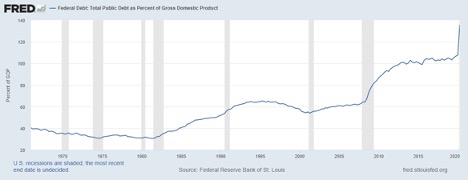
The graph below puts some historical perspective on the amount of federal debt outstanding relative to the amount of income (GDP) generated in the U.S. Relatively speaking, federal deficits and increasing federal debt were not much of an issue until the 1980s. Federal debt as a percentage of GDP rose to over 50% by the end of the decade. In the 1990s, following a decade early recession, federal debt as a percentage of GDP topped 65%; federal budget surpluses helped reduce the level to approximately 55% by the end of the decade. The return of budget deficits after the turn of the century increased federal debt as a percentage of GDP to nearly 65% prior to the financial and economic crisis of 2007-2009; it increased to 84% be the end of the crisis. The Covid-19 economic contraction and stimulus brought federal debt as a percentage of GDP new heights. At the end of the second quarter of 2020, federal debt to GDP stood at 135%, a 50% increase from a decade earlier.
Federal Debt as a Percentage of U.S. GDP
1966 – 2020 2nd Qtr.
The Congressional Budget Office Analysis of Debt
Does the United States have too much debt?
On September 21, 2020, the Congressional Budget Office (CBO) released its Long-Term Budget Outlook for the U.S. It presents the fiscal challenges that will be faced by future administrations. The CBO Budget Outlook includes the following assumptions
- The economic impact of Covid-19 is included in the analysis.
- Current laws affecting revenues and spending generally remain unchanged.
- Individual tax rates revert to their 2017 levels in 2025 due to the 2018 tax bill sunset provisions.
- The current corporate tax rate of 21% remains intact as it has no sunset provision.
- Spending for Medicare and Social Security continues as scheduled even after their trust funds are exhausted.
The following are key results taken directly from the CBO analysis:
- “Deficits. Even after the effects of the 2020 coronavirus pandemic fade, deficits in coming decades are projected to be large by historical standards. In CBO’s projections, deficits increase from 5 percent of gross domestic product (GDP) in 2030 to 13 percent by 2050—larger in every year than the average deficit of 3 percent of GDP over the past 50 years.”
- “Debt. The projected budget deficits would boost federal debt to 195 percent of GDP by 2050. High and rising federal debt makes the economy more vulnerable to rising interest rates and, depending on how that debt is financed, rising inflation. The growing debt burden also raises borrowing costs, slowing the growth of the economy and national income, and it increases the risk of a fiscal crisis or a gradual decline in the value of Treasury securities.”
- “Spending. After the effects of increased spending associated with the pandemic dissipate, spending as a percentage of GDP rises in CBO’s projections. With growing debt and higher interest rates, net spending for interest nearly quadruples in relation to the size of the economy over the long term, accounting for most of the growth in total deficits. Also increasing are spending for Social Security (mainly owing to the aging of the population) and for Medicare and the other major health care programs (because of rising health care costs per person and, to a lesser degree, the aging of the population).”
Summarizing the debt and deficit analysis by the CBO – both increase significantly. Federal debt explodes to 195% of GDP by 2050 if current government revenue and spending streams do not change. The U.S. is already well on the way to reaching that figure. A federal debt to GDP level of 195% could put the U.S. economy in an extremely precarious position, with increasing borrowing costs, potential inflation, increased interest rates, and even the possibility of a significant financial crisis. The debt challenges create policy challenges. Social Security programs are already under financial strain. The policy challenge is to balance tax revenues, the mix of those revenues (corporate and individual) and government spending on programs with an acceptable level of debt. Those are difficult challenges to meet prudently without political divisiveness, but with divisiveness those challenges may not be met.
For further information:
- U.S. Budget Surplus or Deficit from the Federal Reserve
- Major Holders of U.S. Treasury Securities from the U.S. Treasury
- U.S. Federal Debt from the Federal Reserve
- U.S. Federal Debt as a Percentage of GDP from the St. Louis Federal Reserve
- A summary of the financial status of Social Security from the Trustees
CBEI Series: Divisiveness and the Economic Challenges of 2021
Challenge #1: COVID-19 and the 2021 Economy
Challenge #2: Controlling U.S. Debt and Federal Budget Deficits
Challenge #3: Manufacturing and Trade
Challenge #4: Healthcare
Challenge #5: U.S. Economic Leadership
Challenge #6: Wages

Kevin Bahr is a professor emeritus of finance and chief analyst of the Center for Business and Economic Insight in the Sentry School of Business and Economics at the University of Wisconsin-Stevens Point.