
The U.S. Bureau of Labor Statistics (BLS) announced that inflation increased 0.8 percent in February on a seasonally adjusted basis after rising 0.6 percent in January. For the 12-month period ending in February, the annualized inflation rate was 7.9 percent, the largest 12-month increase since 1982. A key driver of U.S. inflation has been surging energy costs.
According to the BLS, the rise in gas prices accounted for almost a third of February’s increase in inflation. For the 12-month period ending in February, energy prices rose over 25 percent while gas prices increased 38 percent. Initially the strong economic recovery (rising demand) and supply chain issues (falling supply) contributed to an increase in energy prices. Most recently, the rise in energy prices has been driven by the Russian military aggression against Ukraine. This blog will focus on two aspects of energy pricing:
- How have U.S. oil prices changed compared to global oil prices?
- How do changes in the price of oil relate to changes in the price of gas?
Global Oil Prices vs. U.S. Oil Prices
Two of the prominent benchmarks for oil prices are Brent Crude and West Texas Intermediate (WTI) crude. According to Investopedia.com, Brent Crude is the most widely used global benchmark for oil pricing, with approximately two-thirds of global crude contracts tied to the Brent Crude oil price. Brent Crude is the main benchmark for European oil prices, as the crude is derived from four different oil fields in the North Sea. WTI crude is the primary benchmark for United States oil prices and refers to oil extracted from U.S. wells and sent via pipeline to Cushing, Oklahoma. Both Brent Crude and WTI crude are viewed as ideal for the refining of gas and diesel fuel.
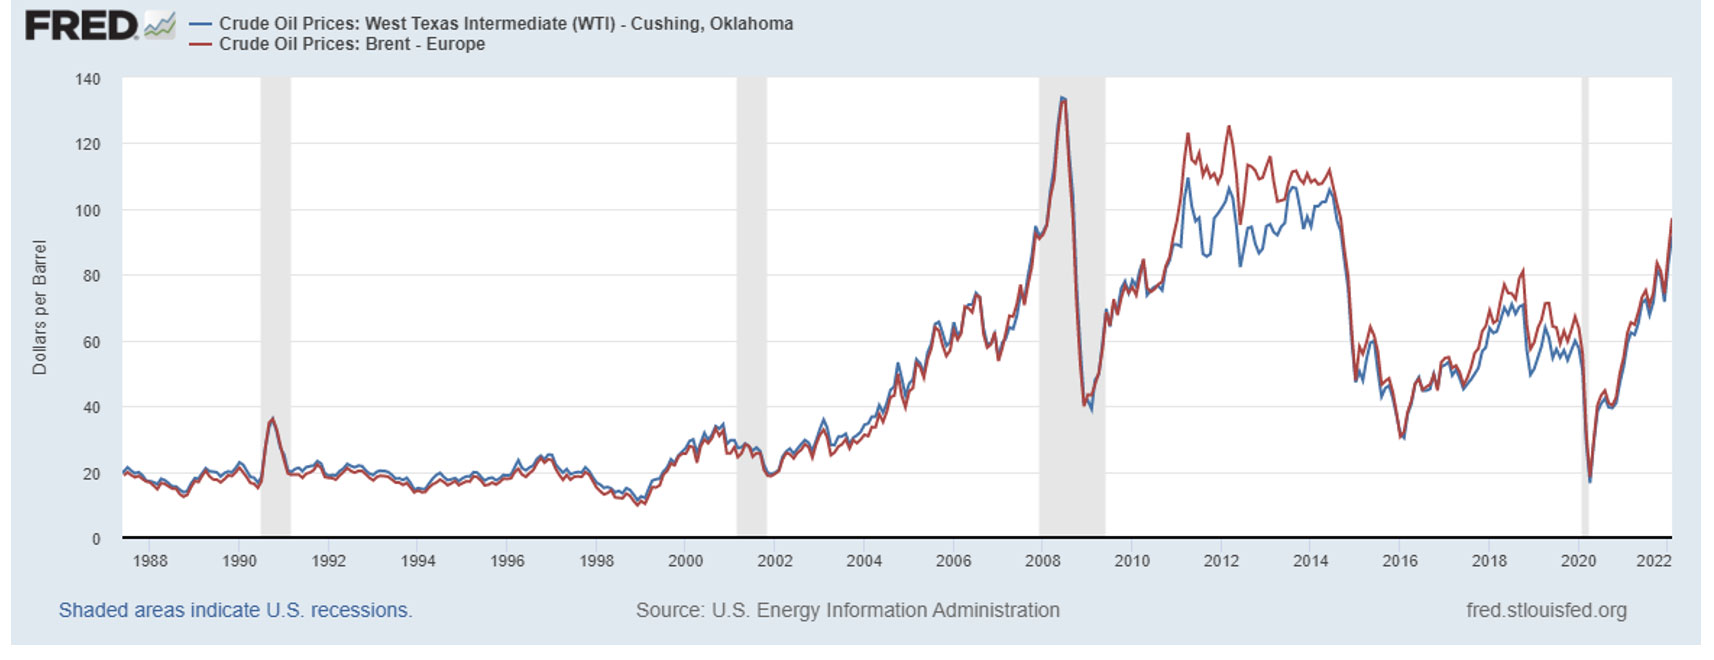
The graph below shows the average monthly price of WTI crude relative to the average monthly price of Brent Crude over the period January 1990 through February 2022. Although differences exist between oil markets, the overall ups and downs of U.S. and European oil prices are strongly related, indicating a truly global energy market. Energy costs have been driving inflation, not only the U.S. but also in Europe and globally. According to Eurostat, energy price increases in the European Union were similar to those in the U.S., with energy prices increasing at an annualized rate of over 25% in January 2022.
West Texas Intermediate Crude Oil Prices (U.S.) vs. Brent Crude Oil Prices (Europe), January 1990–February 2022
Changing Oil Prices and Changing Gas Prices
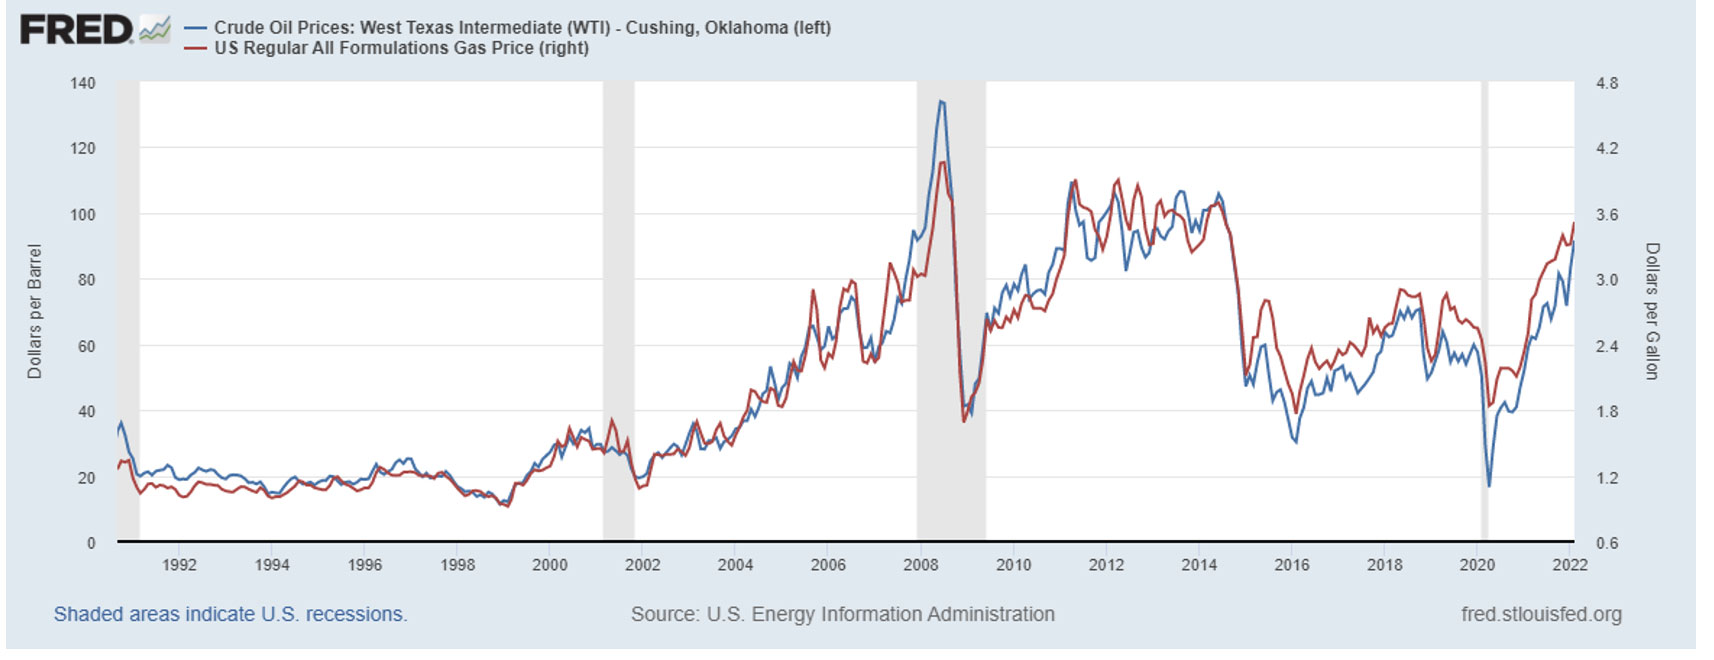
The graph below shows the average monthly price of WTI crude oil relative to the average monthly price of U.S. regular gas over the period September 1990 through February 2022. Although differences exist in the factors that affect each market, the overall trend in changes in gas prices strongly reflects the overall trend in changes in oil prices.
West Texas Intermediate Crude Oil Prices (U.S.) vs. U.S. Regular Gas Prices, Monthly, September 1990–February 2022
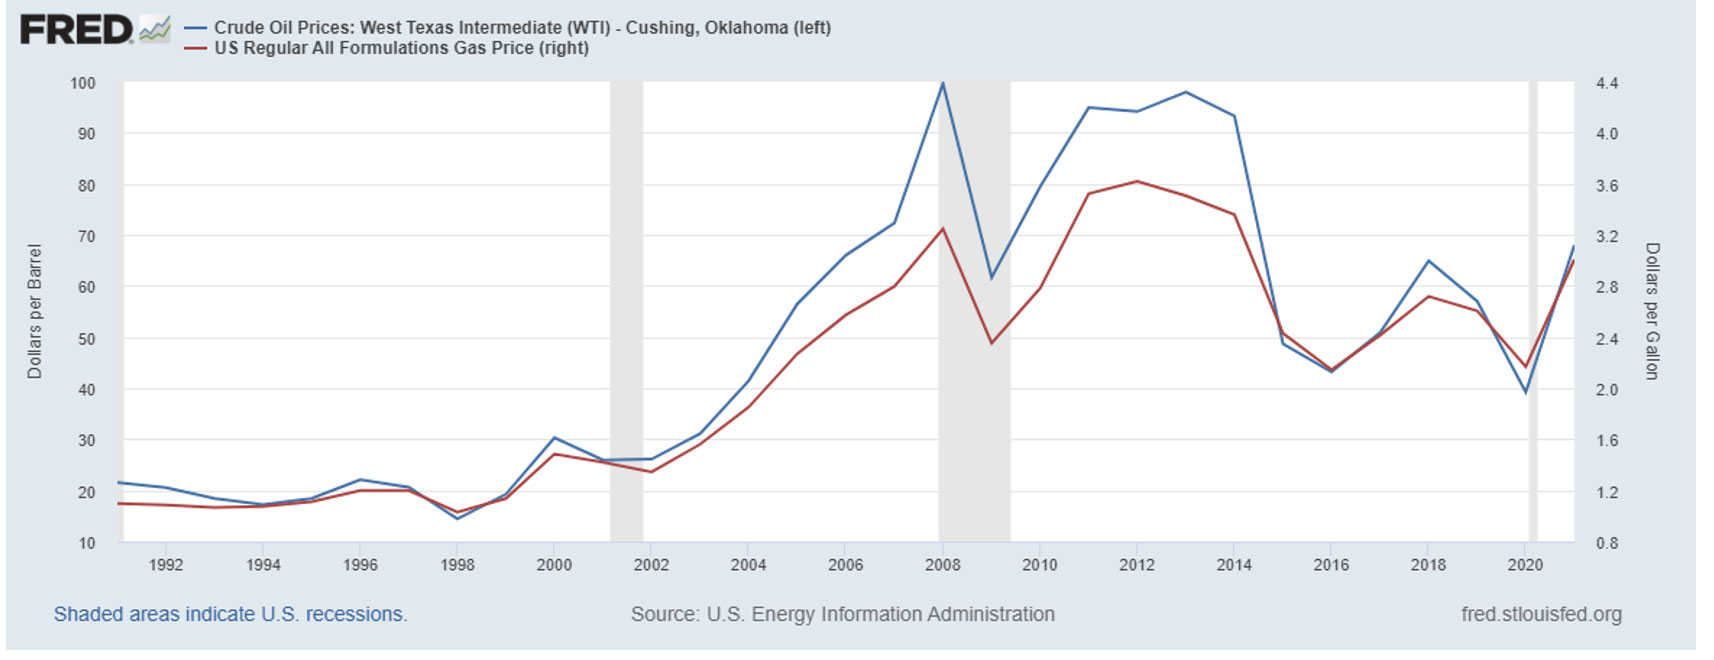
The chart below focuses more on longer-term changes in pricing, by comparing the average annual price of WTI crude oil relative to the average annual price of gas since 1991. Smoothing out the monthly volatility in oil and gas prices provides an even stronger indication of how changes in gas prices reflect changes in oil prices. Although there are differences in the annual percentage change in oil prices and the annual percentage change in gas prices, there is a strong relationship in the overall trend, with increasing gas prices generally reflecting increasing oil prices and decreasing gas prices reflecting decreasing oil prices.
West Texas Intermediate Crude Oil Prices (U.S.) vs. U.S. Regular Gas Prices, Annual, 1991–2021
Recently the Russian invasion of Ukraine has increased prices and uncertainty in global energy markets. Increasing energy costs have been driving global inflation, with energy prices increasing over 25% in both the Unites States and Europe over the past year. It is a global energy market, with U.S. and European oil prices strongly related. And when oil prices change, those changes will likely be reflected in gas prices. The Russian invasion of Ukraine has created uncertainty and supply concerns in the global energy markets. Until those concerns wane, inflationary pressures due to Russia’s invasion will likely persist.
For More Information
- Information on the recent CPI From the Bureau of Labor Statistics
- Federal Reserve Economic Data (FRED) for West Texas Intermediate oil prices: West Texas Intermediate Oil Prices
- From the U.S. Energy Information Administration: Gas Prices
- From Investopedia.com: Oil Benchmarks
- From Eurostat: European Union Inflation

Kevin Bahr is a professor emeritus of finance and chief analyst of the Center for Business and Economic Insight in the Sentry School of Business and Economics at the University of Wisconsin-Stevens Point.