

Manufacturing employment is often viewed as a key benchmark for the U.S. labor market, as manufacturing jobs are generally higher paying and manufacturing of certain products is vital to the strategic interests of the United States.
In recent years manufacturing jobs have been in the spotlight for a variety of reasons. Tariffs were implemented in 2018 by the Trump administration with a partial objective of boosting U.S. manufacturing employment by returning jobs to the U.S. COVID provoked unprecedented supply chain disruptions and caused many companies to rethink supply chains and foreign sourcing. The Biden administration made several investments to increase manufacturing employment, including the CHIPS and Science Act of 2022 that promotes a return of semiconductor manufacturing jobs to the U.S.
Since January 2025, manufacturing jobs and tariffs are back in the spotlight with the current Trump administration, with a partial objective for tariffs to return manufacturing jobs to the U.S. The One Big Beautiful Bill Act also included numerous tax breaks and incentives for manufacturers.
The U.S. Bureau of Labor and Statistics defines manufacturing as “establishments engaged in the mechanical, physical, or chemical transformation of materials, substances, or components into new products.” This definition includes the production of not only heavy machinery, vehicles, and electrical components, but also items such as beverages, vegetable preserves, and stationary. It does not include companies engaged in the design and marketing of products.
Through the years much has changed for U.S. manufacturing. This blog will look at long-term trends and recent developments in U.S. manufacturing employment, and discuss the factors behind the changes in manufacturing employment.
Long-term Trends in Manufacturing Employment: 1939 – 2026
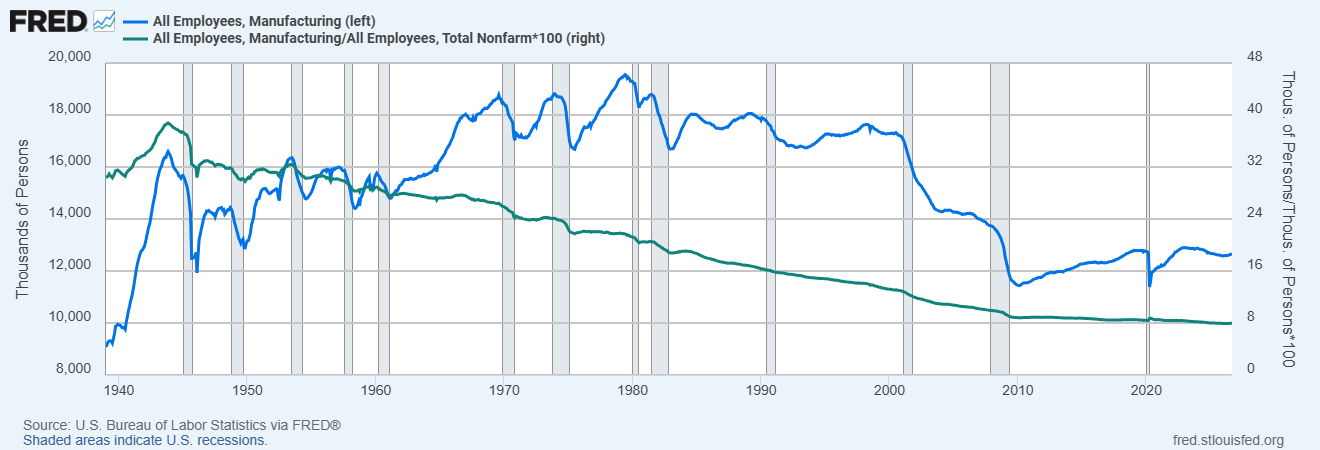
The chart below shows the long-term trend in U.S. manufacturing employment from January 1939 through September 2026. Manufacturing employment is indicated by the blue line (left-axis); manufacturing employment as a percentage of total employment is indicated by the green line (right axis).
U.S. Manufacturing Employment (in thousands) and Manufacturing Employment as Percentage of Total Employment January 1939 – September 2026
- Blue Line – Manufacturing Employment (in thousands), left-axis
- Green Line – Manufacturing Employment as a Percentage of Total Employment, right axis
Manufacturing employment has generally been on a downward trend in the United States since 1980. Prior to 1980, excluding the industrialized ramp-up that occurred due to Word War II, manufacturing employment experienced steady but cyclical growth. From 1939 through 1979 the number of people employed in the manufacturing sector generally increased, from 9.077 million in January 1939 to a peak of 19.553 million in June 1979. Things began to change for U.S. manufacturing in the 1980s, and a downward trend in manufacturing employment began in 1980. After starting the decade at 19.282 million, manufacturing employment ended the decade at 17.881 million, a decline of over 7%. The economic decline in the early 1990s contributed to a drop in manufacturing employment, but excellent economic growth later in the decade led to a rebound.
The downward trend for manufacturing employment returned after the turn of the century with a sharp decline that generally continued through early 2010. Despite a period of general economic growth before the financial crisis of 2008, manufacturing employment declined over 20% between January 2000 and December 2007 from 17.284 million to 13.739 million. During that same time, total employment rose 5.6% from 131.011 million to 138.395 million. Over the decade, manufacturing employment declined from 17.284 million in January 2000 to a low of 11.465 million in December 2009, a drop of 33%. Compared to the peak of over 19.5 million in 1979, manufacturing employment had declined approximately 41% by 2009.
After hitting a low of 11.439 million in early 2010, manufacturing employment steadily rose and generally mirrored economic growth, and was 12.760 million by the end of the decade. Manufacturing employment was relatively unchanged in 2019, despite tariffs and corporate tax breaks from the 2018 tax bill that encouraged investment in manufacturing employment. Even with the growth in manufacturing employment following the 2008 financial crisis, the manufacturing sector ended the decade with approximately 1 million fewer employees than what it had before the financial crisis. Manufacturing employment was 12.760 million in December 2019, an approximate 6.5% drop from the October 2007 level of 13.756 million. COVID took a toll on the economy in 2020, and manufacturing employment dropped over 10% from 12.745 million in January to a low of 11.382 million in April. Manufacturing employment began rebounding in May 2020 and rose back to 12.693 million by the end of 2024.
As a percent of total employment, manufacturing employment peaked during World War II in October 1943 at 38.9%. However, after peaking in 1943, the percentage of people employed in the manufacturing sector has generally been on a long and steady decline. By early 1980, manufacturing employment comprised slightly more than 21% of total employment. By the end of 2024, manufacturing employment was only about 8% of total employment.
Recent Developments in Manufacturing Employment: January 2025 – September 2026
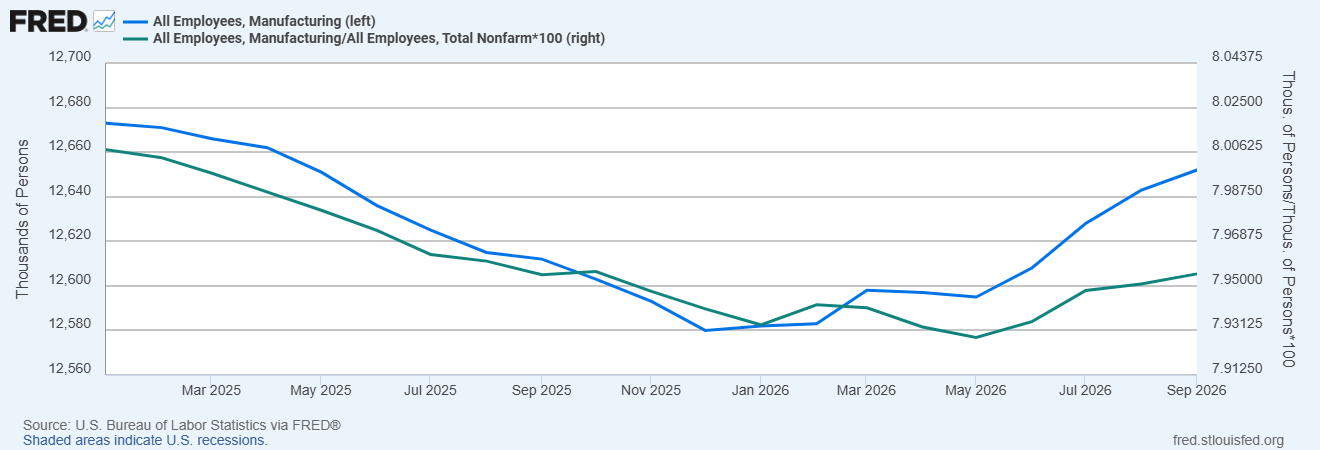
The chart below focuses on recent changes in manufacturing employment from January 2025 through September 2026. Manufacturing employment is indicated by the blue line (left-axis); manufacturing employment as a percentage of total employment is indicated by the green line (right axis).
U.S. Manufacturing Employment (in thousands) and Manufacturing Employment as Percentage of Total Employment January 2025 – September 2026
- Blue Line – Manufacturing Employment (in thousands), left-axis
- Green Line – Manufacturing Employment as a Percentage of Total Employment, right axis
In 2025, the fall in manufacturing employment and manufacturing employment as a percentage of total employment continued. Manufacturing employment began the year at 12.673 million and gradually declined to a record low of 12.580 million in December. Manufacturing employment as a percentage of total employment decreased from 8.00 percent in January to 7.94 percent in December. Manufacturing employment rebounded in 2026, rising from the record low of 12.580 million in December 2025 to 12.652 million in September. The September 2026 manufacturing employment of 12.652 million was still 41,000 below the December 2024 level of 21.693 million. Manufacturing employment as a percentage of total employment rose to 7.96 percent in September after hitting a record low of 7.92 percent in May.
Factors Affecting Manufacturing Employment
A variety of factors have contributed to changes in manufacturing employment at various points in time. Selected factors are discussed below, listed in no particular order of importance. Significant structural changes have occurred in global manufacturing since 1980.
1. Automation and Productivity
Automation has played an extremely important role in increasing labor productivity in manufacturing and has contributed to the decline in manufacturing employment. Labor productivity is defined as output per hour per worker. Increases in productivity can result from automation through greater operational efficiencies in manufacturing. Rising productivity can reduce the demand for workers, as fewer workers are needed to produce a given amount of output. Productivity is also important for consumers, as rising productivity can lower the cost of manufactured products and in turn reduce pricing pressures for consumers.
The graph below shows manufacturing sector labor productivity (output per hour per worker) and U.S. manufacturing employment from January 1987 through September 2026. Between 1987 and 2007, automation contributed to significant increases in manufacturing labor productivity, which factored into dramatic declines in manufacturing employment. Labor productivity in manufacturing more than doubled over the period, increasing over 113% between the first quarter of 1987 and fourth quarter of 2007. During that same period, manufacturing employment declined 21.3%, falling from 17.465 million in January 1987 to 13.739 million in December 2007. Since 2010, manufacturing productivity has been relatively stagnant while manufacturing employment has increased slightly. According to MIT, manufacturing productivity has suffered due to a lack of technological investments, wage stagnation, China’s competitiveness, greater geographic dispersion of manufacturing, and tariff policies.
Manufacturing Sector Productivity and U.S. Manufacturing Employment (in thousands)
January 1987 – September 2026
- Blue Line – Manufacturing Labor Productivity, left-axis
- Green Line – Manufacturing Employment (in thousands), right axis
2. Global Shift to Service Sector Economies
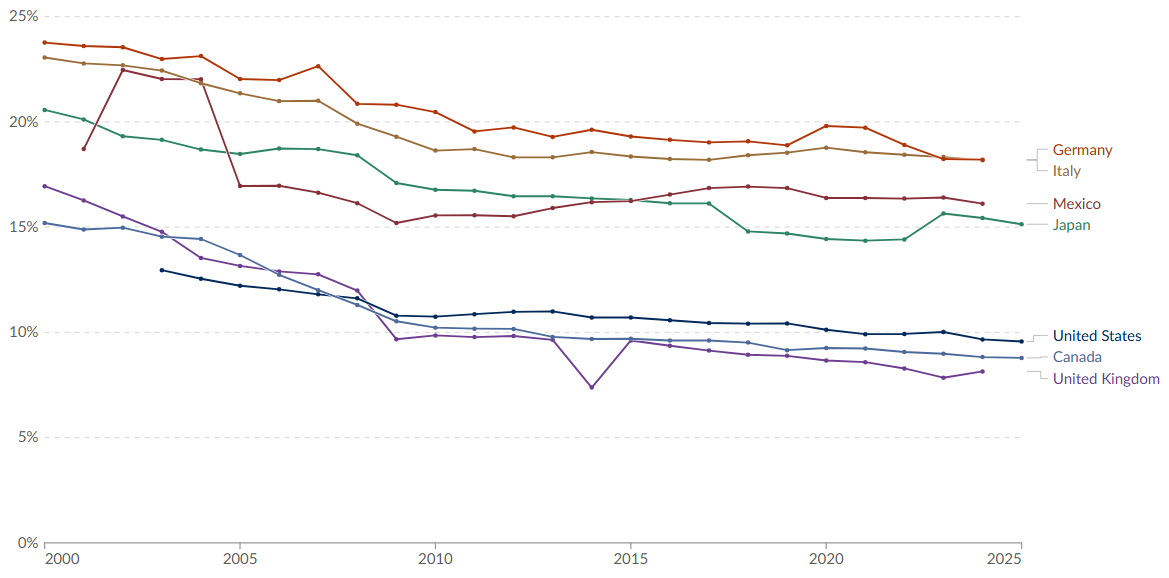
The decline in manufacturing employment as a percent of total employment is not just a U.S. phenomenon. The chart below shows manufacturing employment as a percent of total employment since the turn of the century for seven developed economies: 1) Germany, 2) Italy, 3) Mexico, 4) Japan, 5) United States, 6) Canada, and 7) Great Britain. In each case, manufacturing employment as a percent of total employment declined. Automation and globalization have changed the manufacturing environment, with service sector jobs, including healthcare, education, leisure and hospitality, information technology, and financial services, becoming increasingly important.
Manufacturing Employment as a Percent of Total Employment, 2000-2025
3. Globalization and Offshoring
The globalization of international trade began to significantly increase in the decade of the 1980s. Excluding recessions, both imports and exports have consistently increased since the 1980s. The graph below shows U.S. imports of goods and services (blue line) and exports of goods and services (green line). Quarterly data in billions of dollars is shown at a seasonally adjusted annual rate. Before 1980, U.S. trade in goods and services was negligible. Between the first quarter of 1985 and the fourth quarter of 1999 imports increased from $397.3 billion to $1,332.7 billion while exports rose from $306.0 billion to $1,031.0 billion. Between the first quarter of 2000 and the second quarter of 2026, U.S. imports climbed from $1,409.5 billion to $4,674.9 billion while exports were up from $1,052.9 billion to $3,794.6 billion. Despite the implementation of global tariffs by the U.S. in 2025, both exports and imports were at record levels in the second quarter of 2026.
U.S. Imports and Exports of Goods and Services (seasonally adjusted annual rate)
1985 first quarter – 2026 second quarter
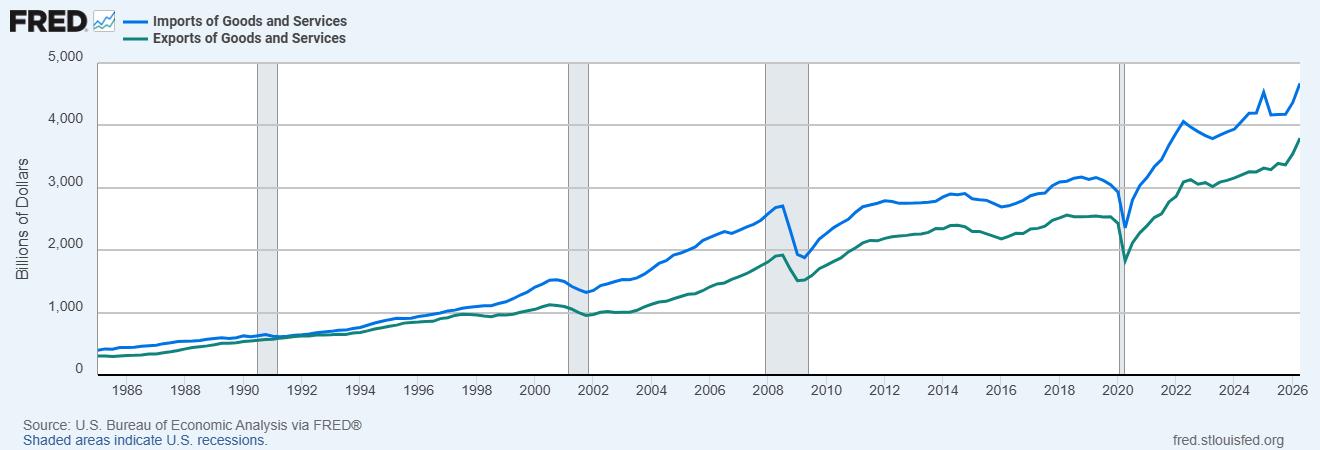
- Blue Line – Imports of Goods and Services (in billions)
- Green Line – Exports of Goods and Services (in billions)
Globalization contributed to declining manufacturing employment as it provided greater access to low-cost sourcing options for U.S. businesses, primarily through low labor cost countries. Since the 1980s, global supply chain networks have evolved for many companies and industries. Companies can source inputs and products globally to minimize costs, maximize profits, and expand markets.
The Conference Board estimated that in 1997 hourly compensation costs in manufacturing for Mexico were only 11% of what they were in the United States. In 2016, hourly compensation costs in manufacturing for Mexico were only 10% of what they were in the United States. Hourly compensation costs in manufacturing for China were estimated at less than 5% of U.S. costs until 2009 but were still only 11% of U.S. costs in 2013. Low-cost sourcing options for companies contributed to low inflation for consumers from the early 1990s until the onset of COVID in 2020. Between 1992 and 2020, inflation never exceeded 4.0% and was greater than 3.0% in only six years.
Low labor costs and expanding technological and manufacturing capabilities increased the attractiveness of sourcing from countries such as China, Mexico, and Vietnam. The graph below shows U.S. imports of goods from three low-cost labor countries – China (blue line), Mexico (green line) and Vietnam (brown line). Monthly data is shown in millions of dollars not seasonally adjusted. Imports from China consistently rose from 1985 before peaking in October 2019 at $52,081.1 million. This decade, tariffs and political pressures have contributed to a gradual and consistent decline in imports from China. Imports dropped to $37,762.9 million in December 2024, a decline of over 27% from the October 2019 high. Imports from Mexico and Vietnam consistently rose since 1985, with significant increases since January 2025. Between January 1985 and December 2024, imports from Mexico increased from $1,303.3 million to $38,3981.9 million while imports from Vietnam rose from $0 to $11,745.3 million.
A new wave of relatively high tariff rates against China caused a significant decline in imports since January 2025 and contributed to U.S. companies resourcing from other low-cost labor countries. Imports from China declined over 35%, from $41,770.4 million in January 2025 to $27,070.7 million in July 2026. The drop in imports from China was more than offset by increases in imports from other low labor cost countries such as Mexico and Vietnam. Imports from each country increased significantly since January 2025, as U.S. companies adjusted sourcing in response to differences in tariff rates between countries. Between January 2025 and July 2026, imports from Mexico rose nearly 50% and climbed from $41,597.1 million to $60,549.6 million while imports from Vietnam more than doubled from $12,991.6 million to $26,419.4 million.
U.S. Imports of Goods from China, Mexico, Vietnam
January 1985 – July 2026
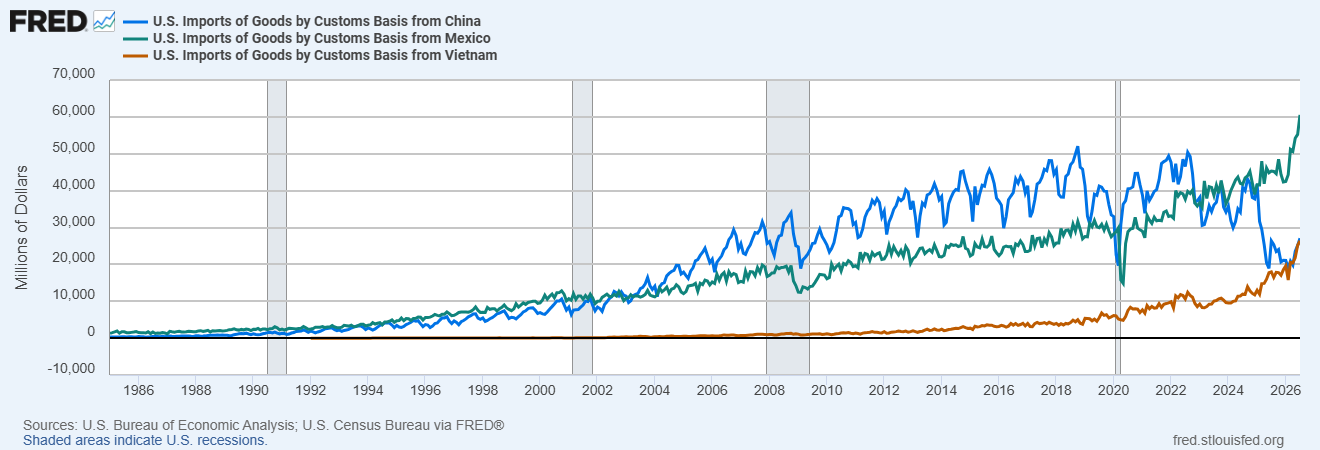
- Blue Line – U.S. Imports of Goods from China (millions of dollars)
- Green Line – U.S. Imports of Goods from Mexico (millions of dollars)
- Brown Line – U.S. Imports of Goods from Vietnam (millions of dollars)
The transition from manufacturing to a more service sector economy was not associated with a decline in income. While it certainly affected workers within specific industries, the switch to a more service sector economy was associated with an increase in real GDP per capita. The table below shows how real imports of goods and services (import value adjusted for inflation) and real GDP per capita increased since 1980. Using real rather than nominal dollar amounts will allow analyzing the changes in each after adjusting for inflation. Real GDP per capita measures output per person in a country with greater per capita output leading to greater income. Real GDP per capita is one variable to assess the standard of living because it measures income per capita. It is not an all-inclusive measure of the standard of living, as it does not consider factors such as income distribution, health care costs, access to healthcare, safety, environmental factors, etc.
Despite globalization and the growth in real imports, real GDP per capita has substantially and consistently increased since 1980. Although manufacturing jobs declined, relatively high paying service sector jobs such as engineering, information technology, marketing, and finance have increased.
Real U.S. Imports and Real GDP per Capita
(Imports are Billions of Chained 2017 Dollars; First Quarter Annualized rate)

Over the 20-year period from 1980 – 2000, real imports and GDP per capita increased $1,268 billion and $16,958, respectively. The rising trend continued for both real imports and GDP per capita since the turn of the century. Between 2000 and 2026, imports and GDP per capita increased $2,138 billion and $21,522, respectively. Although globalization may have contributed to a decrease in manufacturing employment, it was also a contributing factor to increasing real GDP, and consequently, income per capita. As incomes rise, households generally spend a larger share on services like healthcare, education, leisure and hospitality, and entertainment.
4. Value of Dollar
Although not the primary factor, the value of the dollar is one of the factors that can affect manufacturing employment. The chart below shows the trade-weighted value of the U.S. dollar relative to major foreign currencies and the federal (fed) funds effective (market) rate between 1980 and 2020. When the value of the dollar increases relative to foreign currencies, imports become cheaper, as the purchasing power of the dollar increases in terms of foreign currencies. U.S. exports become more expensive, as it costs more in terms of the foreign currency to purchase U.S. goods. A rising dollar value can have negative consequences on manufacturing employment, as imports become more attractive and U.S. exports decrease.
Changes in U.S. interest rates can have a significant impact on the value of the dollar, as increases in interest rates may increase the demand for dollar denominated investments, such as Treasury securities. The increased demand for dollar denominated investments increases the demand for the dollar; consequently, the value of the dollar rises. The value of the dollar rose significantly in the early 1980s, driven in part by the Federal Reserve policy to dramatically increase interest rates to battle high inflation. The Federal Reserve targets the fed funds rate to balance inflation with economic growth. The fed funds rate is a very short-term interest rate that when changed, typically has a rippling effect through the financial markets. In periods of rising or high inflation, the Federal Reserve will typically increase the fed funds rate to reduce consumer and business spending, as borrowing costs are generally increased.
The fed funds rate approached 20% in 1981, causing the value of the dollar to increase by over 50% between 1980 and 1985. Strong economic growth in the late 1990s led by the internet explosion, combined with rising interest rates, also contributed to another sharp rise in the value of the dollar. Between 1995 and 2001, the value of the dollar increased by over 40%. The strong dollar contributed to the decline in manufacturing employment, and strategic decisions to outsource products are not easily or quickly reversed.
Trade Weighted U.S. Dollar Index and Federal Funds Effective Rate
1980 – 2020
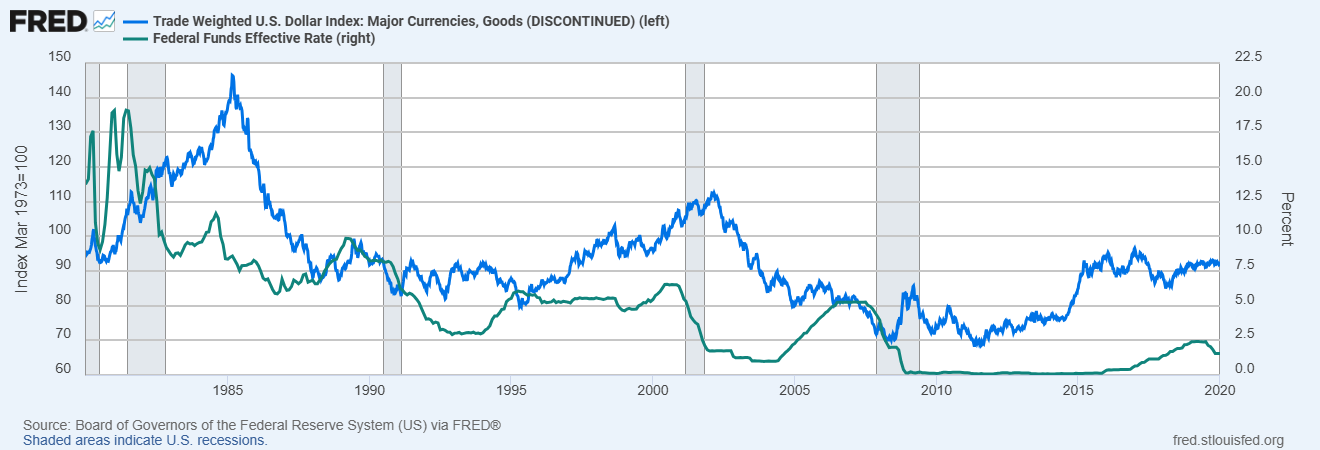
- Blue Line – Trade Weighted U.S. Dollar Index: Major Currencies, left-axis
- Green Line – Fed Funds Effective Rate, right axis
5. The 2026 Manufacturing Employment Increase: Tariffs, Fiscal Incentives, and Data Centers
Through September, manufacturing employment increased 72,000 in 2026. However, the increase follows record low manufacturing employment in December 2025. The September 2026 manufacturing employment of 12.652 million was still 41,000 below the December 2024 level of 21.693 million.
The ultimate impact of tariffs on manufacturing employment is not easy to discern. On the one hand, tariffs raise demand for protected domestic products as imports become more expensive, but they also raise input costs for manufacturers that use imported products and invite retaliation against exports. Any reshoring that increases costs to manufacturers will likely result in increased prices to consumers.
A variety of factors in addition to tariffs can affect the decision to expand U.S. manufacturing, including the desire to increase or change sourcing options, government subsidies and tax incentives, product/market expansion, changing market conditions, and the state of the economy.
In some cases, the additional tariff costs and political pressure prompted some firms to relocate sourcing to the United States. However, reshoring has also occurred as firms evaluate supply chains following the problems created by the pandemic. In addition, legislation such as the CHIPS and Science Act and the One Big Beautiful Bill Act encouraged investment through numerous tax breaks and incentives for manufacturers. In effect, the U.S. government has reduced manufacturing costs by subsidizing manufacturers. The exact reason or reasons that a firm increases manufacturing in the U.S. is not always clear. Over the past twelve months, the leading manufacturing sectors for employment gains were 1) transportation equipment manufacturing (+31,000), fabricated metal product manufacturing (+24,200), and 3) electrical equipment, appliance, and component manufacturing (+17,300).
Tariffs have significantly impacted small businesses, generally negatively. The Federal Reserve’s 2025 Small Business Credit Survey utilized 6,525 responses from a nationwide sample of small employer firms with 1–499 full- or part-time employees to determine the financial performance, challenges, and expectations of small business across the United States. Below are the findings:
- Forty-eight percent of firms reported that they sourced at least some of their inputs from outside the United States in 2024, while 14% said they did so for more than half of their inputs.
- Almost half of U.S. small businesses (42%) indicated rising costs due to tariffs in 2025, and felt the rising costs were a primary financial challenge. 69% of retail firms, 62% of manufacturers, 61% of leisure and hospitality firms, and 56% of healthcare and education firms reporting that tariffs have created profitability pressures.
- Seventy-six percent of businesses with higher input costs reported passing at least some of these higher costs on to customers, while 60% reported absorbing at least some of these cost increases. Relatively few firms reported changing to domestic (13%) or different foreign (8%) suppliers or relocating their production to the United States (3%).
No doubt, the rapid ramp up of AI and data center construction has been a significant contributor to recently increasing manufacturing employment. The data center construction surge leading to increased manufacturing employment is likely temporary, as the construction of data centers increases manufacturing employment but data centers are not manufacturers. The Economist estimates that nearly a third of the increase in manufacturing output in the first half of 2026 was due to the AI and data center power buildout. Certainly, AI and data center construction has been controversial. Data centers consume enormous amounts of electricity and water, and the ultimate environmental impact and who pays for increased infrastructure and energy costs remains to be seen. Also in 2026, defense industry manufacturing has ramped up because of the Iran war.
Summary
Manufacturing employment has generally been on a downward trend in the United States since 1980. From 1939 through 1979 the number of people employed in the manufacturing sector generally increased, from 9.077 million in January 1939 to a peak of 19.553 million in June 1979. Since 1979 some ups and downs have occurred, but the trend has generally been downward. Manufacturing employment dropped to a record low of 12.580 million in December 2025. As a percent of total employment, manufacturing employment peaked during World War II in October 1943 at 38.9%. However, after peaking in 1943, the percentage of people employed in the manufacturing sector has generally been on a long and steady decline. By early 1980, manufacturing employment comprised slightly more than 21% of total employment. By the end of 2025, manufacturing employment was only about 8% of total employment.
Manufacturing employment rebounded in 2026, rising from a record low of 12.580 million in December 2025 to 12.652 million in September. The September 2026 manufacturing employment of 12.652 million was still 41,000 below the December 2024 level of 21.693 million. The uptick in manufacturing employment in 2026 was significantly aided by the controversial buildup of AI and data centers. Recently, there have been costs to increase manufacturing employment, including government subsidies to manufacturers and increased prices to consumers. The CHIPS and Science Act and the One Big Beautiful Bill Act encouraged investment through numerous tax breaks and incentives for manufacturers. Data centers have received federal and state funding. Tariffs have significantly increased prices to consumers.
Whether or not increases in manufacturing employment can be sustained remains to be seen, but a variety of factors have affected manufacturing employment through the years, including: 1) automation and productivity, 2) the global shift to service sector economies, 3) globalization and offshoring, 4) the value of the dollar, 5) and in 2026 – tariffs, fiscal incentives, and the AI and data center buildup. The ultimate impact of structural and economic changes in manufacturing on future manufacturing employment, as well as costs incurred by the government and consumers to increase manufacturing employment, is yet to be determined.
For further information:
- Info from the Bureau of Labor Statistics:
- From Manufacturing.gov: Manufacturing Incentives Overview
- From MIT Sloan: Future manufacturing: How to solve the US productivity paradox | MIT Sloan
- From the United Nations Industrial Development Organization: Global Manufacturing Employment as a Percent of Total Employment
- From the Conference Board: International Comparisons of Hourly Compensation Costs in Manufacturing, Summary Tables | The Conference Board
- From the U.S. Census Bureau: International Trade Data Main Page
- From Brookings: New evidence on data center employment effects | Brookings
- From the Federal Reserve Bank of Chicago: The Short-Run Employment Effects of the 2025 U.S. Tariffs – Federal Reserve Bank of Chicago
- From the Federal Reserve: 2026 Report on Employer Firms: Findings from the 2025 Small Business Credit Survey
- From Fortune:
- From the Federal Reserve Bank of Cleveland: Trends in Manufacturing in the United States
- From the Economist: Does Donald Trump deserve the credit for America’s manufacturing revival? | The Nightly
- From the Budget Lab at Yale University: Trade and Tariffs

Kevin Bahr is a professor emeritus of finance and chief analyst of the Center for Business and Economic Insight in the Sentry School of Business and Economics at the University of Wisconsin-Stevens Point.