Our last blog looked at how taxes changed in 2018, specifically the tax cuts for individuals and corporations. This blog will take a look at the economy – including how those tax cuts and other factors impacted the economy, and what is likely to impact the economy going forward. The blog is split into six parts – the five things you should know as the economy enters the year 2020, and a summary, including future challenges.
Number 1: Economic Growth and Unemployment – Positive Trends for a Long Time
The United States began 2009 with arguably the worst economic scenario since the Great Depression, an economic scenario that began to unfold in late 2007. A tanking stock market, falling housing prices, increasing unemployment, and an economic recession. Gross Domestic Product (GDP), which measures the U.S. output of goods and services and is the benchmark for measuring economic growth, declined during the last two quarters of 2008 and again in the first quarter of 2009. The 6.4% percent decline in the first quarter of 2009 was the largest decline in GDP since the first quarter of 1982. The unemployment rate began 2008 at 4.9%, but then skyrocketed to 7.2% by the year’s end before topping out at approximately 10% in 2010.
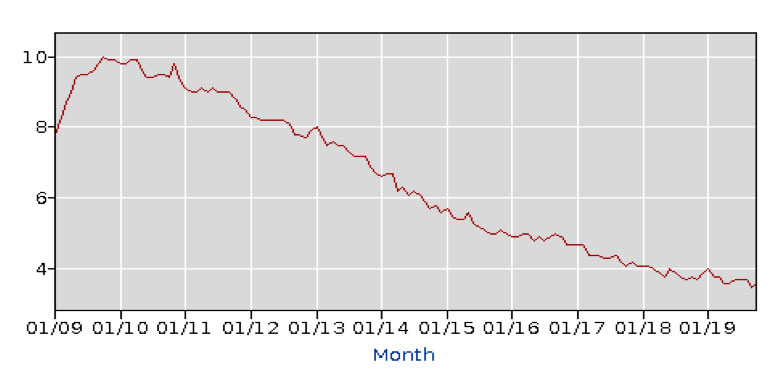
However, in 2010 the economy began to recover. A fiscal stimulus, improving credit conditions, temporarily reduced social security taxes, record low interest rates, and a calming of the financial markets all contributed to the turnaround. The graph below shows the unemployment rate over the past decade. After peaking at approximately 10%, the unemployment rate has taken a long, gradual decline. In 2018 the unemployment rate dipped below 4%, which had not occurred since 1970. The 2018 tax cuts contributed to a continuation of a relatively long period of economic growth following the financial and economic crisis of 2007-2009. A side effect of those tax cuts, increased U.S. budget deficits and debt, will be discussed later.
Unemployment Rate (16 yrs. and older)

Mirroring the drop in the unemployment rate was economic growth as measured by changes in GDP. Beginning in the second half of 2009, GDP has consistently increased each quarter, generally between 1% and 3%. On an annual basis, GDP has increased each year since 2010, reflecting a relatively long period of economic growth. After growing at 1.6% and 2.4% in 2016 and 2017 respectfully, the 2018 tax cuts contributed to increased growth of 2.9% in 2018. As indicated by both the drop in the unemployment rate and increases in economic growth, the tax cuts helped to sustain the economic recovery that began in 2010. According to the National Bureau of Economic Research the current economic recovery is the longest in history, reaching 125 months in November 2019. However, growth has slowed in 2019 relative to 2018. Although the tax cuts helped sustain economic growth, they also have side effects – contributing to an increase in the U.S. budget deficit and government debt.
Annual Percentage Change in GDP

- Unemployment Rate Data from the Bureau of Labor Statistics: Bureau of Labor Statistics
- GDP Growth (and other national data) from the Bureau of Economic Analysis: GDP Growth
- Info on Economic cycles from the National Bureau of Economic Research: Economic Cycles
CBEI Blog Series: The Economy: 5 Things You Should Know for 2020 (and Beyond)
Part 1: Economic Growth and Unemployment – Positive Trends for a Long Time
Part 2: What’s Been Driving Economic Growth
Part 3: The Timing of Those Tax Cuts
Part 4: The Yet to be Paid Increasing Costs of the Federal Deficit and Debt
Part 5: Drivers of The Stock Market
Part 6: Summary and Future Challenges

Kevin Bahr is a professor emeritus of finance and chief analyst of the Center for Business and Economic Insight in the Sentry School of Business and Economics at the University of Wisconsin-Stevens Point.
