
Number 4: The Yet to be Paid Increasing Costs of the Federal Deficit and Debt
The Federal Deficit
The federal budget deficit refers to U.S. federal government spending exceeding government income. According to the Congressional Budget Office, Government spending totaled $4.1 trillion in 2018; government revenues were $3.3 trillion, contributing to a deficit of roughly $800 billion. Government income consists primarily of tax revenues; spending consists of a variety of programs, including Social Security, Medicare, Medicaid, defense, education, infrastructure, and interest on government debt.
Generally, an expanding economy leads to a decrease in the U.S. federal government budget deficit as tax revenues increase. However, the 2018 tax cuts changed that. The graph below shows the U.S. federal budget surplus or deficit since 1990. The shaded areas of the graph indicate an economic recession. Note the economic expansion in the 1990s actually led to budget surpluses. Following the recession of the early 2000s and the financial and economic crisis of the late 2000s, the deficit once again was reduced. However, since 2016, the budget deficit has increased.
In the midst of an economic recession following the turn of the century, the Bush Administration cut income taxes in 2003 to stimulate economic growth. Following the financial and economic crisis of 2007-2009, the Obama Administration cut payroll (social security) taxes in 2011-2012 to stimulate economic growth. Both contributed to economic recovery; the economy grew, federal tax revenues increased, and the deficit decreased. The tax cuts in 2018 were different. The tax cuts were not made to help the economy recover from a recession; there was no recession. Taxes were cut, the rate of economic growth temporarily increased, and the deficit increased.
Federal Budget Surplus or Deficit
Annual amount of Federal Budget Surplus or Deficit in Millions of Dollars (1/1/80-9/30/19)
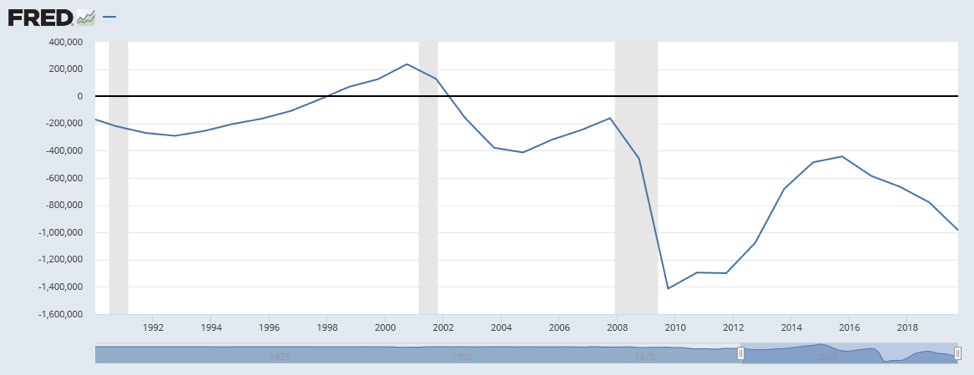
In the current economic scenario, a growing budget deficit is problematic. For the United States, an unemployment rate below 4% pretty much indicates that the government is approaching the maximum amount it will receive from federal individual taxes (given current tax laws). In other words, given the extremely low unemployment rate, it may be hard to lower the rate and significantly increase individual and corporate tax revenues. Putting it another way, if you max out your income and still can’t pay your expenses, you may have a problem if you already have a lot of debt. That discussion is next.
Federal Debt
How does the United States government finance a budget deficit? It basically borrows money from the public through the issuance of U.S. government debt securities called U.S. Treasury securities. The Treasury issues four types of debt (securities) to finance government expenditures: Treasury bills (short-term debt), Treasury notes (medium-term debt), Treasury bonds (long-term debt), and Treasury Inflation Protected Securities (TIPS). Who buys this stuff? Buyers include individuals (you could open an online account with the U.S. Treasury and purchase these securities), large institutional investors, certain mutual funds, and foreign investors and governments. Regarding the foreign investors, China and Japan are by far and away the major foreign investors in U.S. Treasury securities, each holding approximately $1.1 trillion of U.S. Treasury securities and each accounting for nearly 17% of the Treasury debt held by foreign investors. The United Kingdom is a distant third, holding only $341 billion of U.S. Treasury securities and accounting for a little over 5% of the Treasury debt held by foreign investors.
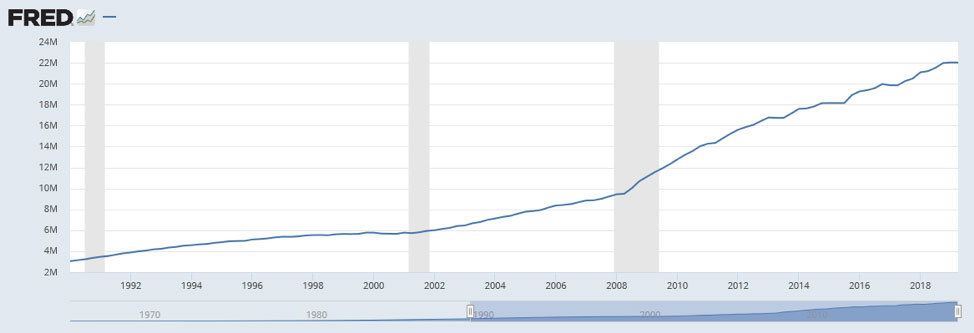
When the U.S. incurs several years of consecutive deficits, the debt issued to fund those deficits starts to pile up. Federal debt actually decreased slightly in the late 1990s, as the U.S. ran federal budget surpluses.
Since 2002, the U.S. has incurred federal deficits. The graph below shows the total federal debt held by the public. From 2000 to 2009, the federal debt approximately doubled, from approximately $5.5 trillion to $11 trillion. In the past decade, the federal debt level has approximately doubled again, from $11 trillion in 2009 to over $22 trillion in 2019. In the past 30 years, the amount of federal debt outstanding has increased approximately six-fold to record level amounts.
Federal Debt: Total Public Debt
Amount of Federal Debt in Millions of Dollars (1980-2019)
Federal Debt and U.S. Income
Does the amount of federal debt matter? Well yes, holders of the debt do have to be paid. However, how much the debt matters kind of depends on how much income the country generates. That income could be taxed to generate revenues that could be used to pay the debt. GDP not only measures output in the economy, it also reflects income. When goods and services are created, income is also created, split between individuals, corporations, and the government. Look at it this way. If you have $100,000 of debt is it a lot? The answer is probably yes if your income is $50,000; the answer is probably no if your income is $50,000,000. The more income, the more debt you can generally financially afford. Federal debt as a percentage of GDP provides a relative measure as to how the federal debt financially burdens the country.
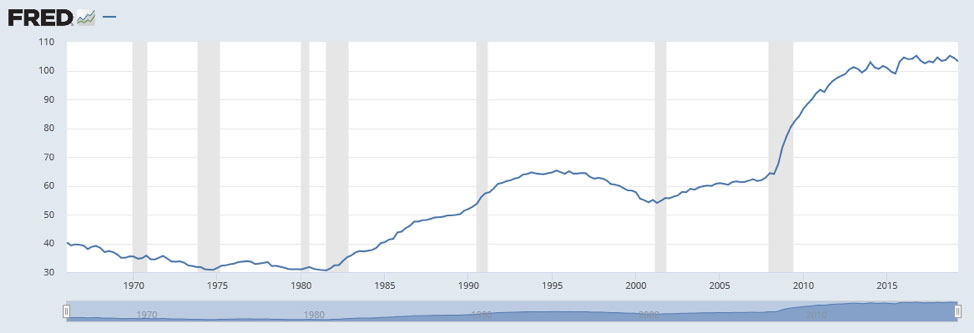
The graph below provides a long-term perspective on the amount of federal debt outstanding relative to the amount of income (GDP) generated in the U.S. Relatively speaking, federal deficits and increasing federal debt were not much of an issue until the 1980s. Federal debt to GDP rose to over 50% by the end of the decade. In the 1990s, following a decade early recession, federal debt to GDP topped 65%; federal budget surpluses helped reduce the level to approximately 55% by the end of the decade. The return of budget deficits after the turn of the century increased federal debt to GDP to nearly 65% prior to the financial and economic crisis of 2007-2009. Federal debt to GDP now stands at over 100%.
Despite recent economic growth and an extremely low unemployment rate, the budget deficit has increased and federal debt has reached record levels. Any economic downturn could significantly increase both and place increased pressure on federal government programs and perhaps prompt further changes in federal tax policy, or a reduction in program expenditures. For example, a looming problem, it is estimated that by 2035 payroll taxes collected will only be enough to pay only about 75 cents for each dollar of scheduled Social Security benefits.
Federal Debt as a Percentage of U.S. GDP
1966 – 2019
For further information:
- The Federal Budget from the Congressional Budget Office (CBO): Federal Budget in 2018: An Infographic
- U.S. Budget Surplus or Deficit from the St. Louis Federal Reserve database
- Major Holders of U.S. Treasury Securities from the U.S. Treasury
- U.S. Federal Debt from the St. Louis Federal Reserve database
- U.S. Federal Debt as a Percentage of GDP from the St. Louis Federal Reserve database
- A summary of the financial status of Social Security from the Trustees
CBEI Blog Series: The Economy: 5 Things You Should Know for 2020 (and Beyond)
Part 1: Economic Growth and Unemployment – Positive Trends for a Long Time
Part 2: What’s Been Driving Economic Growth
Part 3: The Timing of Those Tax Cuts
Part 4: The Yet to be Paid Increasing Costs of the Federal Deficit and Debt
Part 5: Drivers of The Stock Market
Part 6: Summary and Future Challenges

Kevin Bahr is a professor emeritus of finance and chief analyst of the Center for Business and Economic Insight in the Sentry School of Business and Economics at the University of Wisconsin-Stevens Point.