
Number 2: What’s Been Driving Economic Growth
A country’s economic growth is measured by the change in real gross domestic product (GDP). GDP measures the value of goods and services by a country over a given timeframe (typically quarterly or annually). GDP includes four components: 1) Consumer spending, 2) Investment spending, 3) Government Expenditures, and 4) Net Exports (exports minus imports). Investment spending includes the purchase of equipment by firms, the purchase of all newly produced structures (residential and non-residential), changes in business inventories, and investments in intellectual property. The change in real GDP growth means that the effects of inflation (price changes) have been backed out. Changes in real GDP measure the effects of what was produced, rather than any changes in prices.
Consumer spending is the primary contributor to GDP, currently comprising about 68% of GDP. Investment spending and government expenditures each comprise approximately 17.5% of GDP. Net exports comprise -3% of GDP; the number is negative because imports exceed exports.
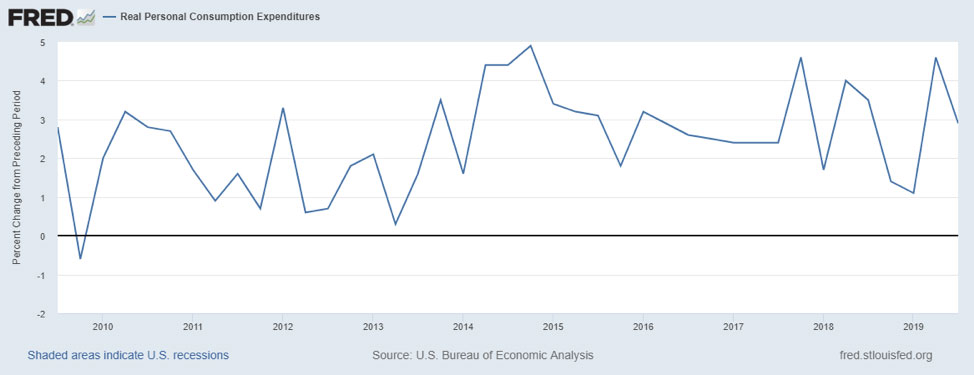
What’s been driving the economic recovery since 2009? By far and away it has been consumer spending. The graph below shows changes in real personal consumption expenditures from the previous quarter over the past 10 years. Ever since the first quarter of 2010, real personal consumption expenditures have increased every quarter, reflecting an expanding economy and falling unemployment rate. Over the past few years growth in real personal consumption spending has been relatively volatile, but always positive. In 2019, growth was only 1.1% in the first quarter, increased to 4.6% in the second quarter, and fell to 2.6% growth in the third quarter. What’s been driving consumer spending? A variety of factors:
- The snowball effect of continued decreasing unemployment since 2010 resulting in increasing income.
- An environment of extremely low interest rates.
- A generally increasing stock market since 2010.
- Tax cuts; including temporarily reduced social security taxes in 2011 and 2012 and the corporate and individual tax cuts of 2018.
- Relatively low inflation.
As long as consumer spending remains strong, the economy will likely remain strong.
Change in Real Personal Consumption Expenditures
Percentage Change from Previous Quarter (3rd Qtr. 2009 – 3rd. Qtr. 2019)
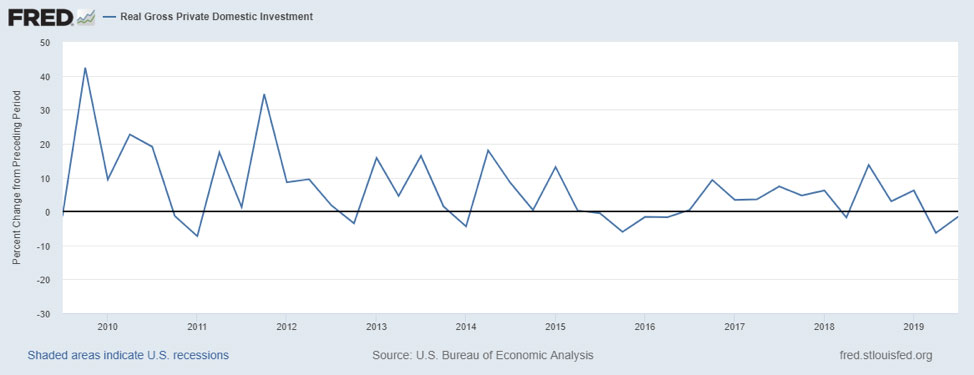
After getting a temporary kick-up in growth in 2018, real gross private domestic investment declined in the second and third quarters of 2019. As a result, investment spending has certainly not been the driving force behind recent economic growth. Despite the incentives created by the 2018 tax act, including the reduction of the corporate tax rate from 35% to 21% and allowing the immediate deduction of capital expenditures, investment spending was only bolstered in the short-term, 2018. Growth peaked at 13.6% in the second quarter of 2018 before declining -6.3% and -1.5% in the second and third quarters of 2019, respectively.
Change in Real Gross Private Domestic Investment
Percentage Change from Previous Quarter (3rd Qtr. 2009 – 3rd Qtr. 2019)
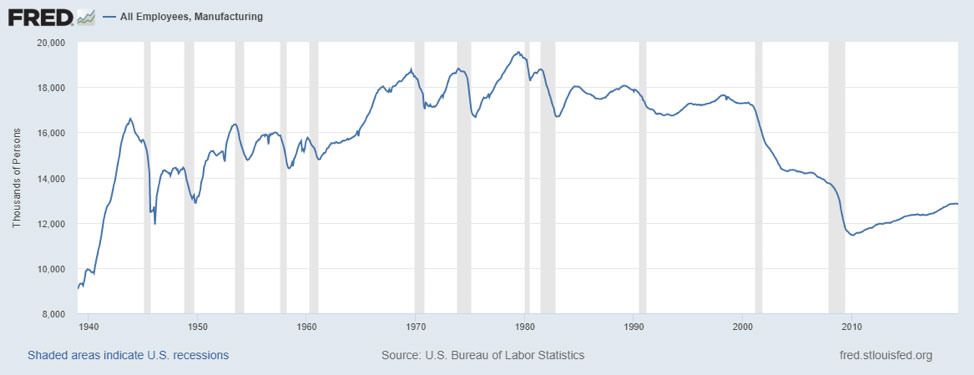
A quick word on manufacturing. One goal of the recent tax bill was to increase manufacturing jobs in the United States. As of late 2019, the impact has been minimal. The graph below shows a long history of manufacturing employment in the United States. After a precipitous decline in employment in the decade following the turn of the century, manufacturing employment steadily grew (along with overall U.S. employment) since 2010, following the financial and economic crisis. However, in 2019 manufacturing employment has remained relatively flat since January. There was actually a slight decline in October employment relative to January.
United States Manufacturing Employment
(January 1939 – October 2019)
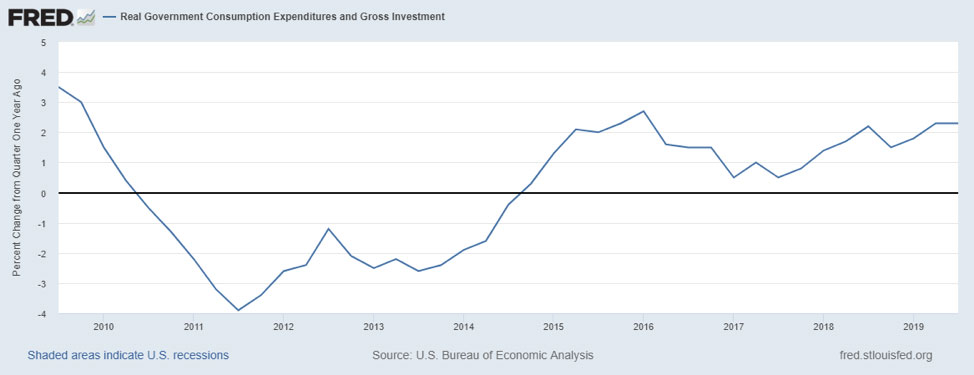
Although its impact on economic growth is not as great as the increase in consumer spending, real government spending has increased since 2015, although the rate of growth has varied. In the second and third quarters of 2019, growth was 2.3%. The return to increased growth in government spending in 2015 followed decreases in government spending that occurred after 2010. Increases in government spending may help short-term economic growth, but they may also add to the budget deficit.
Change in Real Government Spending
Percentage Change from Previous Quarter (3rd Qtr. 2009 – 3rd Qtr. 2019)
For further information from the St. Louis Federal Reserve database:
CBEI Blog Series: The Economy: 5 Things You Should Know for 2020 (and Beyond)
Part 1: Economic Growth and Unemployment – Positive Trends for a Long Time
Part 2: What’s Been Driving Economic Growth
Part 3: The Timing of Those Tax Cuts
Part 4: The Yet to be Paid Increasing Costs of the Federal Deficit and Debt
Part 5: Drivers of The Stock Market
Part 6: Summary and Future Challenges

Kevin Bahr is a professor emeritus of finance and chief analyst of the Center for Business and Economic Insight in the Sentry School of Business and Economics at the University of Wisconsin-Stevens Point.