It’s like nothing that you’ve seen – the pending federal deficit. During the financial crisis, the budget deficit hit approximately $1.4 trillion – a record at the time. According to the Congressional Budget Office (CBO) the budget deficit for fiscal year 2020 (which ends in September) was expected to top $1 trillion before the coronavirus. The tax cuts of 2018 set the stage for record deficits if anything went significantly wrong with the economy. It did. Given the $2 trillion phase III fiscal stimulus and the possibility of another fiscal stimulus, the budget deficit will explode. Unfortunately, the coronavirus will have a double whammy on the economy. Not only will the fiscal stimulus increase government expenditures by almost 50%, tax revenues will contract significantly as corporate and individual incomes decline.
In the current economic scenario, an appropriate and large enough fiscal stimulus had to take priority over any deficit concerns. The impact of the coronavirus on the U.S. economy was too detrimental. Without appropriate fiscal stimulus, a recession could turn to depression. However, the likely record-setting deficit will have significant consequences moving forward, and decisions will have to made regarding government spending and tax policy.
Generally, an expanding economy leads to a decrease in the U.S. federal government budget deficit as tax revenues increase. However, the 2018 tax cuts changed that – they were different. The economy had over eight years of economic growth; the unemployment rate had declined gradually from approximately 10% in 2009 to nearly 4% at the end of 2017. Contrary to tax cuts in 2003 and 2011-2012, the 2018 tax cuts were implemented when the economy was expanding and the unemployment rate was relatively low.
The largest cuts were to corporate taxes. The corporate tax rate was lowered significantly from 35% to 21%. In addition, taxable income could be lowered through capital expenditures (spending on property, plant, and equipment) which could be expensed (a tax deduction in the year of the expense) rather than depreciated (allocating the cost and spreading the deduction over the life of the property). Owners of small businesses also benefitted. Many small businesses are organized as “pass-through” businesses, where the business does not pay tax, but the owners do. Sole proprietorships, partnerships, LLCs, LLPs, and S corps are pass-through businesses. The new tax law allowed pass-through owners to deduct up to 20% of their net business income from their income taxes. Finally, individual tax rates were cut approximately 2-3% in each income bracket, although deductions were limited.
According to the Office of Management and Budget, corporate taxes as a percent of GDP fell from 1.5% in fiscal year 2017 to only 1.0% in 2018. Individual income taxes as a percent of GDP actually increased from 8.2% in fiscal year 2017 to 8.3% in 2018. Another effect of the 2018 tax bill was how the resulting split between individual and corporate taxes comprised total federal tax revenues. In fiscal year 2018, corporate income taxes comprised 6.1% of federal tax revenue compared to 9.0% in 2017. The 6.1% rate was the lowest rate ever based on Office of Management and Budget data available since 1934. Conversely in fiscal year 2018, the contribution of individual income taxes to total federal tax revenue increased. Federal income tax revenue from individual income taxes comprised 50.6% of federal tax revenue in fiscal year 2018 compared to 47.9% in 2017. The 50.6% rate for individual income taxes was not the highest rate ever based on Office of Management and Budget data available since 1934.
The 2018 tax cuts contributed to growing federal deficits. The graph below shows the U.S. federal budget surplus or deficit since 1980. The shaded areas of the graph indicate an economic recession. Note the economic expansion in the 1990s led to budget surpluses. Following the recession of the early 2000s and the financial and economic crisis of the late 2000s, the deficit once again was reduced as tax cuts helped spur economic growth. The tax cuts in 2018 were different. The tax cuts were not made to help the economy recover from a recession; there was no recession. Taxes were cut, the rate of economic growth temporarily increased, but the deficit increased. Since 2016 the budget deficit has increased; and increasing deficits during an economic expansion were problematic.
Federal Budget Surplus or Deficit
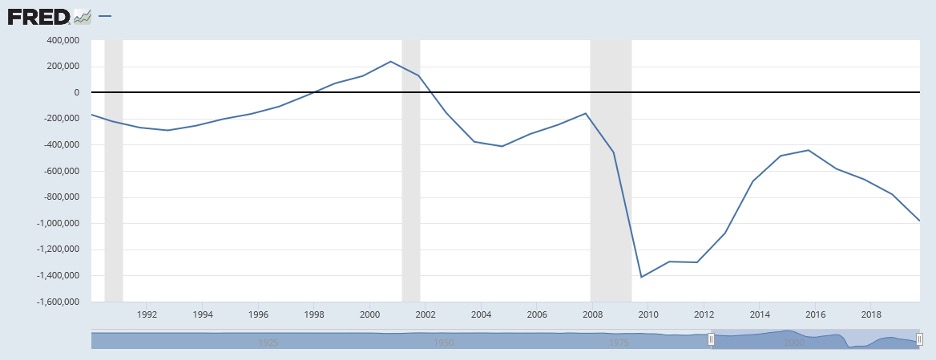
Source: Graph from Federal Reserve Economic Database (FRED) based on data from the U.S. Office of Management and Budget
Federal debt as a percentage of GDP provides a relative measure as to how the federal debt financially burdens the country. That number is at record levels and will likely continue to go up. Total federal debt increases can be mitigated by Federal Reserve policy which includes the purchase of Treasury securities, but that ability is limited. The graph below provides a long-term perspective on the amount of federal debt outstanding relative to the amount of income (GDP) generated in the U.S. Relatively speaking, federal deficits and increasing federal debt were not much of an issue until the 1980s. Federal debt to GDP rose to over 50% by the end of the decade. In the 1990s, following a decade early recession, federal debt to GDP topped 65%; federal budget surpluses helped reduce the level to approximately 55% by the end of the decade. The return of budget deficits after the turn of the century increased federal debt to GDP to nearly 65% prior to the financial and economic crisis of 2007-2009. Federal debt to GDP now stands at over 100%.
Federal Debt as a Percentage of U.S. GDP
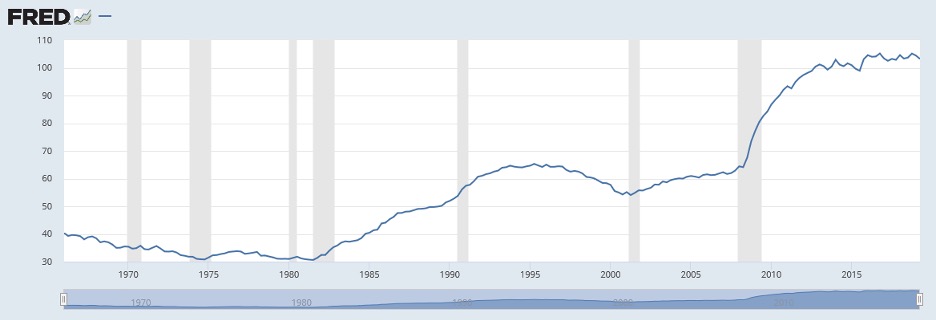
Source: Graph from Federal Reserve Economic Database (FRED) based on data from the U.S. Office of Management and Budget
Going forward, the deficits will have to be dealt with. The pending deficit should provide a needed short-term boost to the economy. However, long-term changes in tax policy and/or government spending, will have to be made. That could create some interesting political battles, because the deficits will likely be significant and be a long-term detriment to economic growth. (The Trump Administration had already proposed reductions to Social Security programs in its fiscal 2020 budget prior to the coronavirus). Although the fiscal stimulus spending will subside, tax revenues may take some time to recover. The coronavirus may also change the preferences of the public as to how the government spends its money. Healthcare and social programs became prominent topics of discussion once again with the impact of the coronavirus.
And regarding those “social programs”, over the past decade there has been government spending on numerous individual and corporate social programs, including Social Security, the Financial Crisis bailouts (a $700 billion Toxic Asset Relief Program to purchase bad loans and investments from financial institutions; $80 billion to GM and Chrysler to remain solvent), and the Phase III coronavirus stimulus ($500 billion to distressed corporations and $377 to small businesses in addition to direct payments to individuals and expanded unemployment insurance).
The bottom line – government spending has included both individual and corporate social programs. On the revenue side, changes in tax policy have lowered corporate tax revenues relative to individual tax revenues. Going forward, changes will likely be made to government spending and/or tax revenues. Exactly what those changes are will likely be the subject of much political debate.
One final point. The deficit problem will impact both states and the federal government. Tax revenues will shrink in combination with increased costs related to the pandemic – for both.
For further information:
- U.S. Federal Debt as a Percentage of GDP from the St. Louis Federal Reserve database:
U.S. Federal Debt as a Percentage of GDP
U.S. Budget Surplus or Deficit
- From the congressional Budget Office, budget projections:
www.cbo.gov/topics/budget
- From the Office of Management and Budget, tax revenue by source: www.whitehouse.gov/omb/historical-tables
CBEI Blog Series: The Coronavirus – Why the U.S. Economy Will Never be the Same
Part 1: What Happened – A Review of the Economic Impacts
Part 2: What Happened – A Review of the Stock Market
Part 3: What Will Change – Supply Chains
Part 4: What Will Change – Healthcare
Part 5: What Will Change – Deficits and Government Spending
Part 6: What Should Change – An Appreciation for Service Sector Workers
Part 7: What Should Change – Securities Regulation of Congress

Kevin Bahr is a professor emeritus of finance and chief analyst of the Center for Business and Economic Insight in the Sentry School of Business and Economics at the University of Wisconsin-Stevens Point.