This article was originally a part of the Center for Business and Economic Insight Spring 2021 Presentation.
The United States is emerging from one of the most challenging and unique economic periods in its history. This challenging economic period was different from others. The economic downturn wasn’t the result of financial market problems or other economic imbalances; it was due to a pandemic. Over a half million Americans lost their lives to COVID-19. Like other economic crises, if there is a problem, the problem needs to be fixed before the economy can return to its normal growth. Hopefully, the significant ramp-up in vaccinations that has occurred will make the virus a bad memory by the end of 2021.
This report will provide a summary of what’s been going on with the economy and financial markets as well as look forward to the challenges facing the United States beyond COVID-19.
Where We’ve Been
Economic Growth
The decline in economic growth in 2020 ranks as the fifth worst annual decline in GDP since the Great Depression. GDP declined -3.5% in 2020; this compares to a drop of -2.5% in 2009 during the financial crisis. The Great Depression accounts for three of the worst years for economic declines, with 1932 as the worst year with a -12.9% drop in GDP. The economic contraction following World War II accounted for the second worst decline, with a GDP decrease of -11.6% in 1946.
Worst Declines in Annual U.S. GDP (Source: Bureau of Economic Analysis)
- 1932 -12.9%
- 1946 -11.6%
- 1930 -8.5%
- 1931 -6.4%
- 2020 -3.5%
- 2009 -2.5%
After a temporary kick-up in economic growth in 2018 due to the tax cuts, the economy began slowing in 2019. When compared to economic growth of the previous year, every quarter in 2019 had lower economic growth than the corresponding quarter of the previous year.
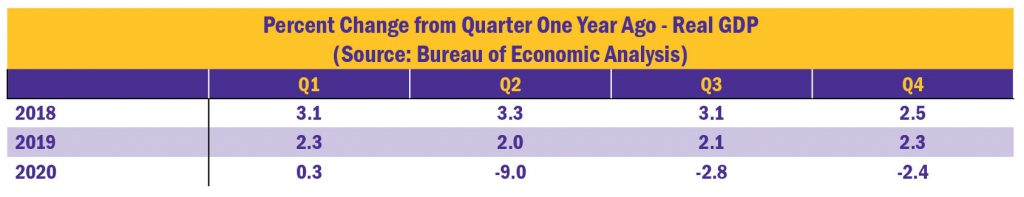
That trend continued in 2020 but was greatly exacerbated by COVID-19. Quarterly growth was less in every quarter in 2020 relative to the prior year, with pandemic driven economic declines beginning in the second quarter. When comparing economic growth to the previous quarter of a year ago, the 2020 second quarter decline of -9.0% was the worst on record since the Bureau of Economic Analysis began tracking quarterly growth in 1947. Although the economy improved in the second half of 2020, third quarter and fourth quarter GDP still declined from the prior year, though the rates of decline fell.
Employment
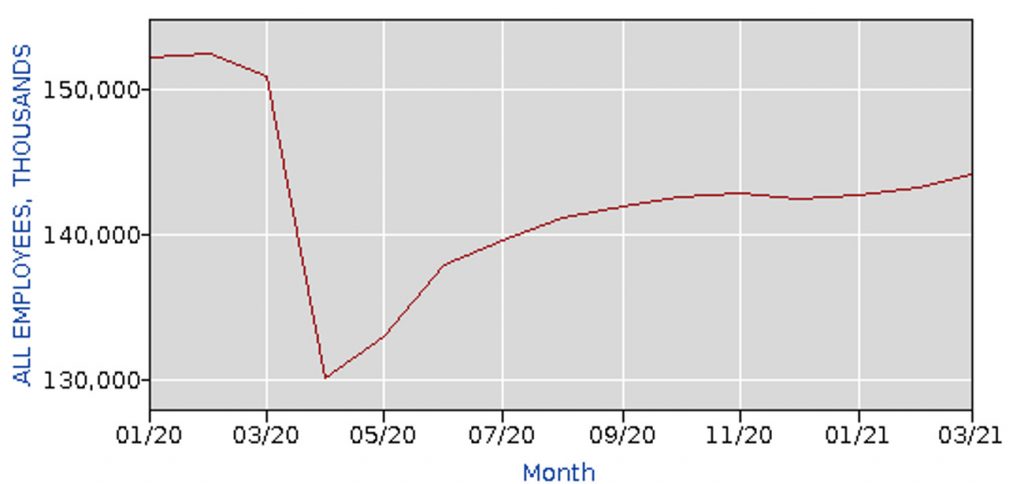
The chart below presents the magnitude of the drop in employment that occurred in 2020 due to COVID-19 and the subsequent recovery. The drop in employment was much greater than what occurred during the financial crisis. Prior to the financial crisis, nonfarm employment peaked at 138.4 million in January 2008 before bottoming out at 129.7 million in February 2010. The decline in jobs lasted slightly over two years with a loss of approximately 8.7 million jobs.
Following the financial crisis, employment grew steadily and consistently from 129.7 million in February 2010 to 152.5 million in February 2020. The employment growth lasted 10 years with approximately 22.8 million jobs added to the economy.
During the financial crisis, employment bottomed out at 129.7 million. The onslaught of COVID-19 caused employment to drop to almost the same level in early 2020. The difference between the two downturns was the speed and magnitude of the declines. During the financial crisis, 8.7 million jobs were lost over two years. During COVID-19, 22.3 million jobs were lost over two months. Prior to the effects of COVID-19 on the economy, employment peaked at 152.5 million in February 2020. Two months later, employment dropped to 130.2 million. By April 2020 employment had declined by approximately 22.3 million. Employment gradually recovered beginning in May 2020, reaching 144 million in March 2021. Despite the increase of approximately 14 million jobs since April 2020, the March 2021 employment was still over 8 million fewer jobs than the employment peak in February 2020. The chart below shows the roller coaster for employment from January 2020 through March 2021.
All Employees, nonfarm Payrolls (seasonally adjusted)
Poverty
An incredibly unfortunate side effect of COVID-19 was the dramatic impact the economic decline had on poverty rates in the United States, particularly among Black and Latino individuals, where poverty rates were already disproportionately high.
The U.S. Census Bureau uses a set of income thresholds that vary by family size and age of family members to determine who is in poverty. The thresholds are updated annually for inflation and apply throughout the United States. Selected 2020 Poverty Thresholds by age and family size are listed in the table below.
Selected 2020 Poverty Thresholds by Age and Family size
Source: U.S. Census Bureau
| One Person Under Age 65 | $13,465 |
| One Person Aged 65 and Older | $12,413 |
| Two Person Household Under Age 65 | $17,331 |
| Two Person Household Aged 65 and Older | $15,644 |
| Family of Three – 1 Child | $20,832 |
| Family of Four – 2 Children | $26,246 |
The impact on COVID-19 on poverty in the U.S. was swift and devastating. According to research by the Center on Budget and Policy Priorities, from February to June 2020:
- The number of non-elderly individuals living in families with combined weekly earnings below the poverty line rose by 14.1 million (28 percent), from 51.0 million to 65.1 million.
- The number of non-elderly Black and Latino individuals with below-poverty family earnings rose by 3.6 million (40 percent) and 4.0 million (34 percent), respectively. Among non-elderly, non-Latino whites, the increase was 4.4 million (17 percent).
- The number of children in families with below-poverty earnings rose by 4.9 million (34 percent), from 14.4 million to 19.4 million.
- increased by 10.8 percentage points among Black individuals, from 26.9 percent to 37.7 percent,
- increased by 7.8 percentage points among Latino individuals, from 22.9 percent to 30.6 percent,
- increased by 3.2 percentage points among non-Latino white individuals, from 17.7 percent to 20.8 percent.
The speed and severity of the impact of COVID-19 on the U.S economy is unfortunately demonstrated by the ramp up in poverty that occurred over only a 5-month period, from February to June 2020. Particularly hit hard were Black and Latino individuals, many of whom were already struggling financially.
The Stock Market
Economic growth, employment, and poverty rates reflect what is currently going on the economy. The financial markets, particularly the stock market, reflect what is expected to happen to the economy in the future.
Stock prices generally reflect expectations for the economy. If the economy grows, corporate profits generally increase, and stock prices increase. Despite the declines in economic growth throughout 2020, after the first quarter of 2020, the U.S. stock market focused on expected post-COVID economic growth.
The table below shows the quarterly returns of three major U.S. stock indexes: 1) the S&P 500 – a diversified index that measures the stock performance of 500 relatively large companies (it is a “large-cap” index, generally comprised of companies having a total stock value exceeding $10 billion), 2) the NASDAQ – an index comprised of over 3000 companies listed on the NASDAQ stock exchange and heavily weighted toward technology, and 3) the Russell 2000 – a diversified index that measures the stock performance of 2000 relatively small companies (it is a “small-cap” index, generally comprised of companies having a total stock value less than $2 billion). For comparative purposes, the long-run average annual return (since 1926) on large-cap stocks is approximately 12 percent; on small-cap stocks, 16%.
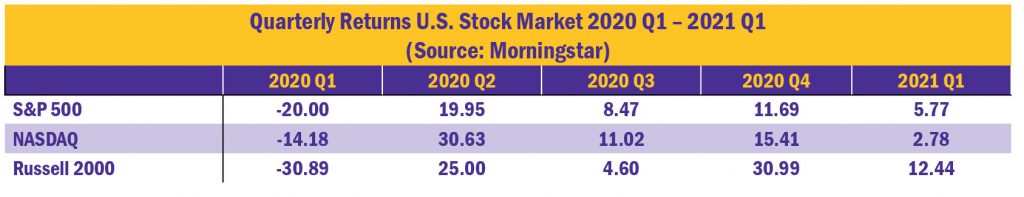
All three indexes significantly declined in the first quarter of 2020. The Russell 2000 (small-cap index) had the steepest drop at -30.89 percent. The S&P 500 (large-cap index) declined -20.00 percent, while the NASDAQ (technology index) fell -14.18 percent. Following the first quarter of 2020, it was up, up, and away for the all the stock indexes as the market looked forward to a post-COVID economic rebound. In the second quarter, the increase in the NASDAQ more than doubled the losses of the first quarter, as the NASDAQ was up 30.63 percent. The S&P 500 and Russell 2000 were up 19.95 and 25.00 percent, respectively, both almost fully recovering the losses of the first quarter. Strong increases continued for each of the indexes for the remainder of 2020. For the full year, the S&P 500 increased 16.26 percent and the Russell 2000 was up 18.36 percent, both higher than their historical average annual return. The NASDAQ increased an astounding 43.64 percent. All indexes increased once again in the first quarter of 2021, with the NASDAQ cooling down from its remarkable run in 2020.
Following the 2020 first quarter, the stock market was clearly looking ahead to a post-COVID economic recovery. Pent-up demand, declining unemployment, low interest rates, and the multiple fiscal stimulus programs painted a very positive picture for economic growth based on stock market performance.
For further information:
- GDP Growth (and other national data) from the Bureau of Economic Analysis: GDP Growth
- Info from the Bureau of Labor Statistics: www.bls.gov
- Info from the U.S. Census Bureau: How the Census Bureau Measures Poverty
- From the Center on Budget and Policy Priorities: Research Note: Number of People in Families With Below-Poverty Earnings Has Soared, Especially Among Black and Latino Individuals
Where We’re Going
The Economy
Since early 2020, the economy has been about COVID-19. If the pandemic could become a distant bad memory, economic growth would consistently return. After the first quarter of 2020, the stock market was already predicting a strong economic rebound after the pandemic. The major question was when, not if, that would occur. In early 2021, following the significant increase of vaccinations and multiple fiscal stimulus programs, there was a growing list of positive economic signs.
- Economic Growth – Finally, in the first quarter of 2021, after a string of eight consecutive quarters in which GDP growth was lower relative to the prior year quarter, GDP growth increased. First quarter 2021 GDP growth was estimated at 0.4% compared to the first quarter 2020 GDP growth of 0.3%.
- Retail and food sales – according to the U.S. Census Bureau, retail and food sales rebounded strongly in March 2021. Initial estimates were that March 2021 retail and food sales increased 9.8 percent from February 2021 and were up 27.7 percent from March 2020. Total sales for the January 2021 through March 2021 period were up approximately 14.3 percent from the same period a year ago.
- First time unemployment insurance weekly claims – weekly unemployment claims continued to drop. According to the U.S. Department of Labor, for the period ending April 10 seasonally adjusted initial claims were at an estimated 576,000, a decrease of 193,000 from the prior week. This was the lowest level for initial claims since March 14, 2020, when it was 256,000.
The United States economy typically chugs along at a pretty good pace unless there is a bump or shock to derail its progress. In 2020, the economic shock was a pandemic. Economic growth can get derailed by inflation (which leads to higher interest rates), a financial crisis, or even a pandemic. Following the onslaught of COVID-19, the challenge was to get the economy moving forward again. Economic numbers from the first quarter of 2021 indicate that the economy is moving forward once again. That growth should continue until the next bump or shock occurs – be it from a pandemic recurrence or some other factor. Economic growth precipitates a snowballing effect, where economic growth continues until something happens to stop it. When economic growth occurs, increased employment leads to more consumer spending, which leads to more economic growth.
After four consecutive quarterly declines during the financial crisis, GDP increased in the fourth quarter of 2009 relative to the prior year quarter. Quarterly increases continued until COVID-19 hit the economy in the second quarter of 2020. The economic growth continued until the pandemic shock ended it. That’s typical for a U.S. economic recovery – growth is generally consistent and continues until the next economic bump or shock. After three consecutive quarters of declines in GDP growth in 2020, GDP growth returned in the first quarter of 2021. That growth should continue until the next economic bump or shock.
President Biden’s Infrastructure (American Jobs) Plan
On March 31 President Biden unveiled a $2 trillion wide-ranging infrastructure plan which would be implemented over an eight-year timeframe. That plan would have a significant impact on how economic growth occurs in the future. The plan includes:
Transportation Infrastructure and Resilience
- $115 billion to repair and rebuild bridges, highways, and roads,
- $20 billion to increase road safety,
- $85 billion to improve and expand public transit,
- $80 billion to upgrade and expand railways, including both freight rail and Amtrak,
- $174 billion for investing in electric vehicles,
- $25 billion to upgrade airports,
- $17 billion to upgrade inland waterways and ports,
- $20 billion to reconnect urban neighborhoods cut off by highways,
- $25 billion for projects to support regional economies,
- $50 billion to improve infrastructure resilience,
Power Grid, Internet, and Water Systems
- $45 billion to replace nation’s lead pipes,
- $66 billion to upgrade water systems in rural areas,
- $100 billion to expand high-speed broadband across the entire country, especially rural areas,
- $100 billion to expand and improve power grid and expand clean energy,
- $10 billion investment for new Corps of Americans to work conserving public lands and water.
- $16 billion for plugging oil and gas wells and restoring abandoned mines,
Housing, Schools, Workforce Development
- $400 billion toward expanding home and community-based care for the elderly and people with disabilities,
- $213 for expanding affordable housing options,
- $112 billion for schools and community college construction,
- $25 billion to expand and upgrade available child-care facilities,
- $28 billion for VA hospitals and government buildings,
- $100 billion in workforce development for underserved groups,
- $300 billion for domestic manufacturing, R&D, pandemic preparedness, and small business.
Taxes, Deficits, Debt, and Inflation
The $2 trillion infrastructure plan would be financed primarily through an increase in corporate taxes. The statutory (legal) corporate tax rate was lowered from 35% to 21% in 2018. The 35% rate had been in place since 1993; the 21% rate is the lowest since prior to World War II. The statutory tax rate is the legal percentage established by law. Lowering the statutory rate certainly lowers the taxes paid by a company.
However, the effective corporate tax rate, the rate that a company actually pays on pre-tax profits, can be much lower than the statutory tax rate due to tax credits and deductions. A 2019 study by the Institute on Taxation & Economic Policy examined the 2018 effective tax rate for 379 profitable firms included in the Fortune 500. For the 379 companies, the study analyzed the effective U.S. income tax rates on their pretax U.S. profits in 2018. Their findings included:
- On average, the 379 profitable corporations paid an effective federal income tax rate of 11.3 percent on 2018 U.S. income; 57 companies had an effective federal income tax rate that exceeded the statutory rate of 21%, while 322 companies had an effective rate below the statutory rate.
- 91 out of the 379 corporations paid no taxes on 2018 U.S. income; 56 companies had an effective federal income tax rate between 0% and 5%.
The Biden plan would increase the statutory corporate tax rate to 28%, impose a minimum tax rate of 15% on the book income of large corporations, and eliminate offshoring tax incentives.
If Congress approves the infrastructure plan, there is a reason why the plan is proposed to be financed primarily through taxes.
When the U.S. government spends more on programs and services than what it takes in through taxes, a budget deficit occurs. In 2020, due to the impact of the pandemic and the needed fiscal stimulus programs, the U.S. budget deficit hit a record $3.1 trillion, more than twice the level of the $1.4 trillion deficit that occurred in 2009 during the financial crisis. To finance a budget deficit the U.S. government borrows money from the public through the issuance of U.S. government debt securities called U.S. Treasury securities. Buyers include individuals, institutional investors, certain mutual funds, and foreign investors and governments. The record 2020 budget deficit also led to a record amount of U.S. government debt outstanding, at nearly $28 trillion by the fourth quarter of 2020. U.S. debt has also more than doubled since the financial crisis, with U.S. debt peaking at $11.5 trillion at the end of the financial crisis.
To better gauge its magnitude, the amount of federal debt outstanding is often compared to the Gross Domestic Product (GDP). GDP not only measures output in the economy, it also reflects income. When goods and services are created, income is also created, split between individuals, corporations, and the government. Federal debt as a percentage of GDP is a measure of a country’s ability to pay its debt. Sort of. The more income, the more debt you can generally afford. The U.S. debt-to-GDP ratio ballooned to a record 135% in 2020, up from 105% in 2019. The 2020 mark was a record for the U.S.; the 135% compares to 80% at the end of the financial crisis.
The difficult question to answer: When does the debt-to-GDP ratio become too high? That’s the hard part; no one really knows. Federal debt as a percentage of GDP provides a rough measure as to how the federal debt financially burdens the country. Increasing debt does lessen the financial flexibility for a country to a certain degree because it increases the potential for financially straining the country through higher interest and principal payments. However, there are a variety of factors in gauging how the federal debt financially burdens the country. The debt-to-GDP is one factor, but other factors include the Federal Reserve, inflation, and interest rates.
In the United States, the Treasury will issue debt to fund budget deficits. The Federal Reserve, which manages the country’s money supply, can buy U.S. Treasury debt in the financial markets (and consequently lower the total debt outstanding). There is a potential drawback. If the Federal Reserve buys too much debt, then inflation may increase due to the increased money supply.
By the end of 2020, federal debt held by the Federal Reserve reached a record $5 trillion. This was approximately double the amount held at the end of 2019, and approximately 7 times greater than the amount of federal debt held at the end of the financial crisis. No doubt, the Federal Reserve has been buying Treasury debt, and a lot of it. The debt-to-GDP ratio peaked at 135% during the second quarter of 2020 but declined to 129% by year-end.
Given the increasing money supply resulting from the Federal Reserve’s purchase of Treasury debt, what has been the impact on expected inflation? The stock market can provide a clue as to what is expected for economic growth; the bond market can provide a clue as to what is expected for inflation.
A variety of factors affect interest rates – inflation is one of those factors. Inflation and interest rates are related. An increase in expected inflation will be reflected by an increase in interest rates, particularly medium and long-term interest rates. Investors want to have a greater return than the rate of expected inflation. As a result, increases in expected inflation will be reflected in the bond market.
The chart below shows the Treasury yield curve on April 1, 2021 relative to one year ago. The Treasury yield curve shows the interest rates on Treasury bonds with different maturities – it shows relationship between short-term and long-term interest rates.
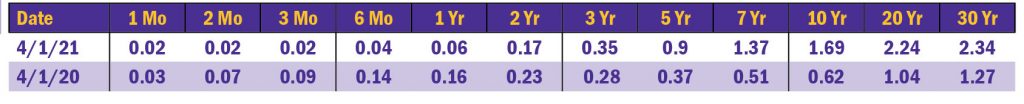
Interest rates have increased slightly across medium and long-term maturities. The interest rate on 5-year bonds increased 53 basis points, from 0.37% to 0.90%. The interest rate on 20-year bonds increased 120 basis points, from 1.04% to 2.24%. The bond market appears to reflect a slight expected increase in inflation. However, interest rates across all maturities are still at relatively low historical levels, with the 30-year bond rate at only 2.34%. The significant increase in Treasury debt by the Federal Reserve is currently not expected to significantly increase inflation.
Another issue with increasing the federal deficit and total debt – the timing of the increase. Generally, during periods of economic duress, deficits will increase as the government needs to spend money to counteract the economic downturn. In periods of economic expansion, generally deficits should at least decrease as tax revenues increase. If you can’t reduce deficits in good economic periods, you never will. A significant side effect of the 2018 tax cuts was to increase the budget deficit in a period of economic growth. That set the stage for a significant increase in the budget deficit if anything went wrong with the economy – like it did.
In 2020, the stimulus programs were going to be financed with debt rather than taxes. The objective was to increase consumer spending to help the economy recover. Raising any tax in 2020 was not a viable or appropriate economic policy option when consumers and businesses were struggling. The $2 trillion infrastructure plan is proposed to be financed with primarily corporate taxes. It is expected that economic growth will return in 2021. The increase in economic growth should provide an opportunity to reduce the budget deficit through increased tax revenues. The debt-to-GDP ratio is relatively high; although there is no specific benchmark as to what is too high, a high ratio indicates any adverse movements in inflation and interest rates could significantly increase borrowing costs. As a result, the proposal is to not increase the deficit and debt in a period of economic growth and the debt level is relatively high. The $2 trillion proposal in effect reallocates spending from primarily corporations to government infrastructure programs.
Summary
Economic optimism returns in 2021. The 2020 stock market predicted an economic rebound, and economic indicators show signs that is beginning to happen. Although uncertainty remains over the pandemic, significant progress has been achieved in fighting the virus. The pandemic was a medical and economic problem. Fixing the problem was crucial for an economic rebound. Economic growth is expected to return in 2021. Exactly how that growth occurs in 2021 and beyond could be significantly impacted by the passage (or not) of President Biden’s $2 trillion infrastructure plan. At the very least, 2021 promises to be another interesting year economically and politically.
For further information:
- From the U.S. Census Bureau: U.S. Census Bureau – Retail Sales
- From the U.S. Department of Labor: Weekly Unemployment Claims
- Details on the American Jobs Plan from the Whitehouse: The American Jobs Plan
- From NPR: By the Numbers – the $2 Trillion Infrastructure Plan
- U.S. Budget Surplus or Deficit from the Federal Reserve: https://fred.stlouisfed.org/series/FYFSD
- Major Holders of U.S. Treasury Securities from the U.S. Treasury: https://ticdata.treasury.gov/Publish/mfh.txt
- U.S. Federal Debt from the Federal Reserve: https://fred.stlouisfed.org/series/GFDEBTN
- U.S. Federal Debt as a Percentage of GDP from the St. Louis Federal Reserve: https://fred.stlouisfed.org/series/GFDEGDQ188S
- Federal debt held by the Federal Reserve: https://fred.stlouisfed.org/series/FDHBFRBN
- From the U.S. Treasury: The Yield Curve
- For a history of corporate tax rates, below is link for a spreadsheet history from the IRS: Historical Table 24 – Internal Revenue Service
- A discussion of the history of corporate tax rates and brackets from the Internal Revenue Service: Corporate Income Tax Brackets and Rates 1909 – 2002
- From the Institute on Taxation & Economic Policy: Corporate Tax Avoidance in 2018

Kevin Bahr is a professor emeritus of finance and chief analyst of the Center for Business and Economic Insight in the Sentry School of Business and Economics at the University of Wisconsin-Stevens Point.