
What happened with manufacturing during the economic recovery? Did manufacturing employment rebound during the recovery? Well, yes and no, it depends on how you look at the numbers.
First, a long-term overview of what has happened to manufacturing employment in the United States. Chart 1 shows two lines. The blue line indicates the number of employees in manufacturing from 1939 through 2019. From 1939 through 1979 the number of people employed in the manufacturing sector generally increased, from a level of 9.3 million in 1939 to a peak of 19.5 million in 1979. A downward trend in manufacturing employment began in 1980. Although manufacturing employment rebounded slightly in the 1990s, the downward trend returned after the turn of the century with a sharp decline that generally continued through early 2010, with manufacturing employment hitting a low of 11.5 million.
The red line in Chart 1 indicates the number of employees in manufacturing divided by total non-farm employment from 1939 through 2019 – in essence, the percentage of people employed in the manufacturing sector. As a percent of total employment, manufacturing employment peaked in October 1943 at 38.9%. Manufacturing ramped up in World War II; manufacturing employment was only 30.3% in January 1939. However, after peaking in 1943, the percentage of people employed in the manufacturing sector has generally been on a long and steady decline, reaching a low of 8.5% in late 2019.
The long-term decline in manufacturing employment, both in terms of numbers and as a percentage of total employment, can be attributable to multiple factors including: 1) the growth of service sector jobs in the economy (financial, healthcare, engineering, retail, etc.), 2) automation, 3) globalization and differences in wage rates, 4) fluctuations in currency exchange rates, and 5) a skills mismatch – the gap between the skills workers have and the skills employers need given changes in manufacturing.
Chart 1: Manufacturing Employment and Manufacturing Employment as Percentage of Total Employment 1939-2019
Source: Federal Reserve FRED Database; Bureau of Labor Statistics
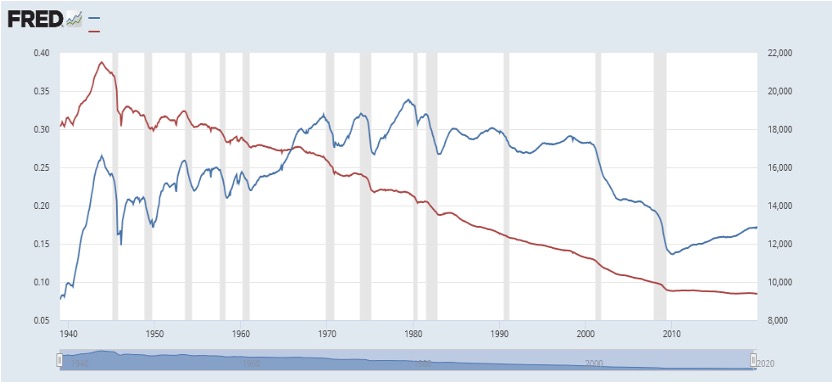
Blue Line (right axis) – Manufacturing Employees (Thousands)
If measured by the peak and low of the stock market, the recent financial crisis began in late 2007 and ended in early 2009. (Before the crisis, the S&P 500 peaked in October 2007 and bottomed out in March 2009.) In October 2007, manufacturing employment totaled 13.8 million and comprised approximately 10% of total employment. By the end of the crisis in March 2009, manufacturing employment fell to 12.2 million and comprised approximately 9.2% of total employment.
What happened to manufacturing employment during the economic recovery? Chart 2 focuses on what happened to manufacturing over the last decade. The blue line indicates the number of employees in manufacturing from 2010 through 2019. After hitting a low of 11.5 million in early 2010, manufacturing employment steadily grew to 12.9 million in December 2019. Manufacturing employment generally grew each year throughout the entire decade, with only 2016 and 2019 having relatively unchanged manufacturing employment. Despite the growth in manufacturing employment during the economic expansion, the manufacturing sector ended the decade with almost 1 million fewer employees than what it had before the financial crisis. Manufacturing employment was 12.9 million in December 2019, an approximate 6.5% drop from the October 2007 level of 13.8 million.
The red line in Chart 2 indicates the number of employees in manufacturing divided by total non-farm employment from 2010 through 2019 – the percentage of people employed in the manufacturing sector. The decade began with manufacturing employment comprising 8.8% of total employment; the decade ended with manufacturing employment comprising only 8.5% of total employment. That compares to manufacturing employment comprising 13.8% of total employment in October 2007.
Chart 2: Manufacturing Employment and Manufacturing Employment as Percentage of Total Employment 2010-2019
Source: Federal Reserve FRED Database; Bureau of Labor Statistics

Blue Line (right axis) – Manufacturing Employees (Thousands)
So, during the economic recovery employment in the manufacturing sector increased – just like employment in most sectors of the economy. Total manufacturing employment grew, but so did total employment in the economy. Manufacturing employment increased from 11.5 million to 12.9 million in the decade but was 6.5% lower than the 13.8 million manufacturing employment in October 2007 as the economic and financial crisis began. As a percentage of total employment, manufacturing employment decreased from a high of 12.0% in 2012 to 8.5% by the end of 2019. This compares to manufacturing employment comprising 13.8% of total employment in October 2007.
The 2018 tax bill reduced the corporate tax rate from 35% to 21% and created an incentive for corporations to invest in property, plant, and equipment (capital spending). Rather than depreciating (allocating) the cost of property, plant, and equipment over a certain number of years as required previously, companies could expense (take a full deduction for) the entire amount beginning in 2018. In other words, an immediate tax benefit for the full amount spent. The expensing of capital spending is allowed through 2022. The impact of the tax bill contributed to a temporary boost in manufacturing employment, increasing both manufacturing employment and its percentage of total employment in 2018. However, the boost was short-lived, as manufacturing employment was relatively unchanged in 2019 and manufacturing employment as a percentage of total employment decreased in 2019. Economic growth, significant corporate tax breaks, and tariffs could not return manufacturing employment to the pre-financial crisis levels of 2007.
Wisconsin
What about manufacturing in Wisconsin? Chart 3 below provides some insight. Wisconsin pretty much mirrored what was happening at the national level. The blue line indicates the number of employees in manufacturing from 1990 through 2019. Similar to what was happening nationally, from 1990 through early 2000 the number of people employed in the manufacturing sector generally increased. In Wisconsin, manufacturing grew from a level of approximately 524,500 in January 1990 to 598,900 by December 1999. Also similar to what happened nationally, manufacturing employment took a sharp decline after the turn of the century and bottomed out in early 2010 at approximately 424,000.
The red line in Chart 3 indicates the number of employees in manufacturing divided by total non-farm employment in Wisconsin from 1990 through 2019 – the percentage of people employed in the manufacturing sector. As a percent of total employment, manufacturing employment has generally declined steadily from 1990, although a brief uptick occurred in the early 1990s. Manufacturing employment as a percent of total employment in Wisconsin was approximately 23.1% in 1990 but fell to only 16.2% in December 2019.
Chart 3: Wisconsin Manufacturing Employment and Manufacturing Employment as Percentage of Total Employment 1990-2019
Source: Federal Reserve FRED Database; Bureau of Labor Statistics
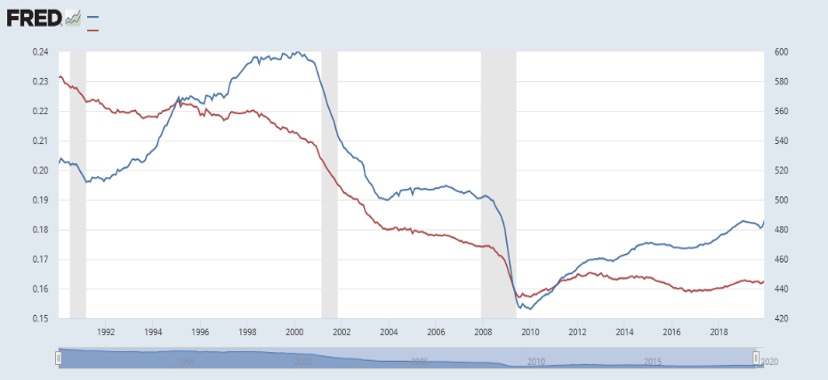
Blue Line (right axis) – Manufacturing Employees (Thousands)
In October 2007, the start of the financial crisis, Wisconsin manufacturing employment totaled 500,900 and comprised approximately 17.4% of total employment.
Chart 4 focuses on what happened to Wisconsin manufacturing over the last decade during the economic recovery. The blue line indicates the number of employees in manufacturing from 2010 through 2019. Similar to national manufacturing growth, manufacturing employment generally grew each year throughout the entire decade. Manufacturing employment grew from 426,200 in January 2010 to 485,200 in December 2019. Similar to national employment, although manufacturing employment generally grew throughout the decade it was relatively unchanged in 2016 and 2019. Also similar to national manufacturing employment, Wisconsin manufacturing employment did not fully recover to levels prior to the financial crisis, although the drop was not as significant as national manufacturing employment. Wisconsin manufacturing employment was 500,900 in October 2007 but was only 485,200 in December 2019, a drop of 3.1%. This compares to the decline of 6.5% in national manufacturing employment over the same period.
As a percentage of total employment, manufacturing employment was more volatile than at the national level. Contrary to national manufacturing employment, in Wisconsin manufacturing employment as a percentage of total employment increased slightly in the decade. The red line in Chart 4 indicates the number of employees in Wisconsin manufacturing divided by total non-farm employment from 2010 through 2019 – the percentage of people employed in the manufacturing sector. The decade began with manufacturing employment comprising 15.7% of total employment; the decade ended with manufacturing comprising 16.2% of total employment. During the decade, manufacturing employment as a percentage of total employment peaked at 16.5% in July 2012, dipped to 15.9% in November 2016, and subsequently increased slightly to finish the decade at 16.2%.
Chart 4: Wisconsin Manufacturing Employment and Manufacturing Employment as Percentage of Total Employment 2010-2019
Source: Federal Reserve FRED Database; Bureau of Labor Statistics
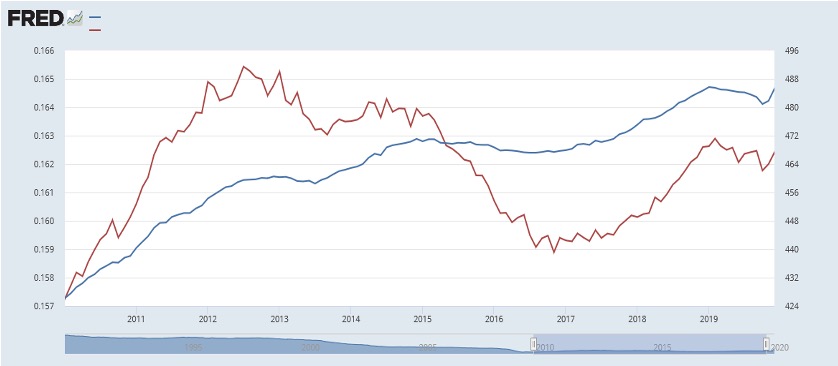
Blue Line (right axis) – Manufacturing Employees (Thousands)
During the economic recovery the trends in the Wisconsin manufacturing sector were similar to national manufacturing employment. Steady manufacturing employment growth occurred throughout most of the decade, except in 2016 and 2019 when there was little change in manufacturing employment. Manufacturing employment increased – just like employment in most sectors of the economy. However, growth in Wisconsin’s manufacturing sector was slightly better than national manufacturing. At the national level, manufacturing employment grew from 11.5 million to 12.9 million in the decade, an increase of approximately 12%. Wisconsin growth was slightly higher, with manufacturing employment increasing from 426,200 in January 2010 to 485,200 in December 2019, a 13.8% growth in manufacturing employment. However, both at the national and Wisconsin state level, manufacturing employment declined from pre-financial crisis levels. Wisconsin manufacturing declined 3.1% compared to the decline of 6.5% in national manufacturing employment over the same period. Similar to national manufacturing employment, Wisconsin manufacturing employment as a percentage of total employment declined relative to pre-financial crisis levels. Wisconsin manufacturing employment as a percentage of total employment was 17.4% in October 2007 and fell to 16.2% in December 2019. At the national level, manufacturing employment as a percentage of total employment decreased from 13.8% in October 2007 to 8.5% by the end of 2019.
For further information:
1. Federal Reserve
FRED Database Manufacturing Employment
FRED Database -Wisconsin Manufacturing
CBEI Series: The Economic Recovery 2010-19: What Changed and What Didn’t
Part 1: Overview
Part 2: Wealth Distribution
Part 3: Manufacturing Employment
Part 4: Trade with China … and the Rise of Vietnam
Part 5: Funding the U.S. Government – Corporate vs. Individual Taxes
Part 6: Corporate Debt and Collateralized Loan Obligations

Kevin Bahr is a professor emeritus of finance and chief analyst of the Center for Business and Economic Insight in the Sentry School of Business and Economics at the University of Wisconsin-Stevens Point.