
Overview
First, a quick long-term overview on trends in business debt. The blue line in Chart 1 below shows the amount of outstanding nonfinancial corporate business debt securities and loans from 1945 through the first quarter of 2020. The shaded areas of the chart indicate recession periods. From a long-term perspective, the amount of corporate debt generally grew throughout the period, with slight decreases occurring during recessionary periods before increasing once again during the economy recovery following the recession.
However, a better way to gauge the change in corporate debt is to look at corporate debt as a percentage of GDP. Over time, corporations grow along with the economy, so it would be expected the amount of debt would increase over time. Corporate debt as a percentage of GDP measures how corporate debt has grown relative to the economy. The red line in Chart 1 shows the amount of nonfinancial corporate business debt securities and loans as a percent of GDP. Each decade the percentage has generally increased, with decreases occurring after recessionary periods but increases during the subsequent economic recovery. By the end of 2019, the amount of nonfinancial corporate business debt securities and loans as a percent of GDP reach a record high of 45.5%, before being surpassed by the 48.1% level of the first quarter of 2020.
Chart 1: Nonfinancial Corporate Business: Debt Securities and Loans 1945-2020
(Billions of dollars)
Source: Federal Reserve FRED Database, Financial Accounts
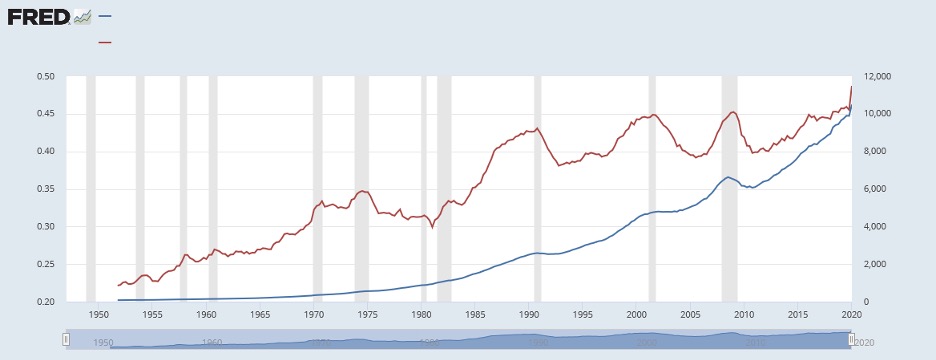
Blue Line (right axis) – Nonfinancial Corporate Business Debt Securities and Loans, (seasonally adjusted)
Corporate Debt and the Economic Recovery
Chart 2 below focuses on the change in corporate debt during the economic recovery of the last decade. The blue line in Chart 2 shows the amount of outstanding nonfinancial corporate business debt securities and loans from 2010 through 2019. The red line in Chart 2 shows the amount of nonfinancial corporate business debt securities and loans as a percent of GDP. Generally, both lines increased throughout the economic recovery. After starting the decade at $6.2 trillion, corporate debt rose to $9.9 trillion by the end of the decade. As a percentage of GDP, corporate debt increased from 41.8% at the start of 2010 to 45.5% in December 2019.
Is the overall trend of increasing corporate debt a problem? Maybe. Of course, for any specific company, the riskiness of debt depends upon the firm’s ability to cover required interest and principal payments. However, the general rise in corporate debt increases the overall risk of corporate distress in periods of economic declines and increases the potential for corporate bailouts. Despite the record period of economic growth, corporate debt as a percentage of GDP increased during the decade. Despite the corporate tax cuts implemented in 2018, corporate debt as a percentage of GDP increased from 44.4% at the end of 2017 to 45.5% in the 4th qtr. of 2019. Economic growth and corporate tax cuts combined did not decrease the level of corporate debt.
Chart 2: Nonfinancial Corporate Business: Debt Securities and Loans 2010-19
(Billions of dollars)
Source: Federal Reserve FRED Database, Financial Accounts
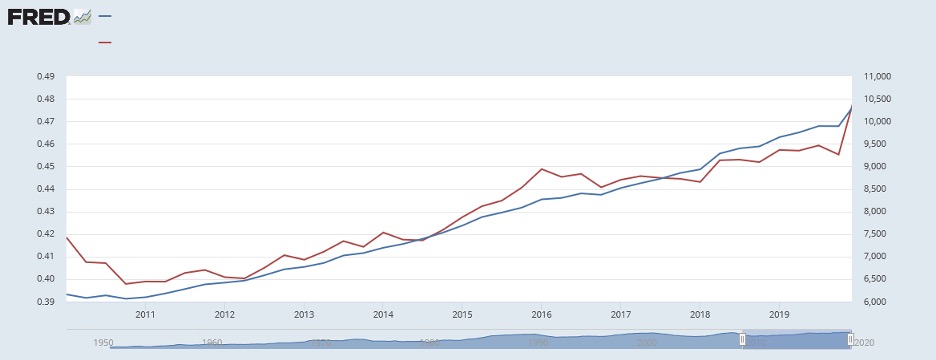
Blue Line (right axis) – Nonfinancial Corporate Business Debt Securities and Loans, (seasonally adjusted)
Collateralized Loan Obligations
Remember mortgage backed securities and the financial crisis? The development of mortgage backed securities in the 1980s allowed banks to sell off mortgage loans to Wall Street firms and Fannie Mae and Freddie Mac (organizations created by the U.S. government). Banks would use the proceeds from the sale of mortgage loans to turn around and make more mortgage loans, thereby increasing their revenues and providing liquidity to the housing market. The buyers of mortgage loans would package the loans and sell mortgage backed securities to investors. A mortgage backed security is a type of debt that represents a small interest in a pool of mortgages. Mortgage backed securities were generally viewed as highly rated debt securities with relatively low default risk. With falling interest rates, easy credit, and a hot housing market, the volume of mortgage backed securities increased significantly in the 1990s and into the 2000s.
As long as homeowners paid on their mortgages or home prices went up, the mortgage backed securities had relatively low risk. Unfortunately, after the turn of the century, interest rates went up, homebuyers faced higher monthly mortgage payments, more homes were put up for sale, and home prices tanked. In 2007, the financial crisis began. Financial institutions that invested in mortgage backed securities and/or made risky loans faced increased financial stress. In 2008 the bailout of ailing financial institutions by the U.S. government began, leading to the $700 billion Troubled Asset Relief Program (TARP), which was essentially bailout funds for banks.
That’s the past, enter the present with collateralized loan obligations (CLOs). Although there are certainly differences, there are some eerie similarities between the development of CLOs and mortgage backed securities. Similar to a mortgage backed security, the CLO is a type of security that is backed by a pool of debt. The difference is in the debt. Mortgage backed securities are backed by mortgages. CLOs are backed by corporate loans. Investors in mortgage backed securities get paid when mortgage payments are made; investors in CLOs get paid when corporations pay on the underlying loans. CLOs are split up into different tranches, in other words, they have different ratings based on the priority of receiving payment from the underlying pool of loans.
The economic recovery led to explosive growth for CLOs. Combining data from the Treasury International Capital (TIC) system and the Securities Industry and Financial Markets Association (SIFMA), the Federal Reserve estimated the amount of outstanding CLOs as topping $100 billion in 2006, $300 billion in 2012, and reaching $617 billion in 2018. A six-fold increase in slightly more than a decade.
Who are the issuers and buyers of CLOs? The primary issuers are incorporated in offshore tax havens, primarily the Cayman Islands; there are also domestic issuers incorporated in Delaware. The offshore incorporation allows CLO issuers to avoid taxes. The domestic investor base may be helped if a domestic issuer is involved with an issue. Institutional investors including insurance companies (28%), mutual funds (16%), and pension funds (10%) held roughly half of Cayman-issued CLOs at year-end 2018. The Federal Reserve estimated that banks held $90 billion, focusing on AAA rated (the top-tier) of CLOs. The top 3 domestic bank holders of CLOs and their estimated holdings: 1) Wells Fargo & Co. $34.6 billion, 2) J.P. Morgan & Co. Inc. $20.5 billion, and 3) Citigroup Inc. at $18.1 billion.
How risky are CLOs and should banks be investing in them? There are differing opinions on this. On the one hand, banks have focused on the top-tier AAA rated CLOs. On the other hand, many mortgage backed securities that were highly rated turned out to be overrated and contributed to bank financial distress during the economic and financial crisis. Time will tell how risky CLOs turn out to be. However, the risk of any corporate debt increases as the volume of corporate debt increases, especially in economic downturns.
For further information:
1. From the Federal Reserve: FEDS Notes
Liu, Emily and Tim Schmidt-Eisenlohr (2019). “Who Owns U.S. CLO Securities?” FEDS Notes. Washington: Board of Governors of the Federal Reserve System, July 19, 2019, https://doi.org/10.17016/2380-7172.2423.
FEDS NOTES: Who Owns CLO Securities?
Guse, Matthew, Woojung Park, Zack Saravay, and Youngsuk Yook (2019). “Collateralized Loan Obligations in the Financial Accounts of the United States,” FEDS Notes. Washington: Board of Governors of the Federal Reserve System, September 20, 2019, https://doi.org/10.17016/2380-7172.2447.
FEDS NOTES – CLOs and Financial Accounts
2. From SP Global Market Intelligence (Andrew Park, 2019)
Those $700B in US CLOs: Who holds them, what risk they pose
CBEI Series: The Economic Recovery 2010-19: What Changed and What Didn’t
Part 1: Overview
Part 2: Wealth Distribution
Part 3: Manufacturing Employment
Part 4: Trade with China … and the Rise of Vietnam
Part 5: Funding the U.S. Government – Corporate vs. Individual Taxes
Part 6: Corporate Debt and Collateralized Loan Obligations

Kevin Bahr is a professor emeritus of finance and chief analyst of the Center for Business and Economic Insight in the Sentry School of Business and Economics at the University of Wisconsin-Stevens Point.