
Overview
First, a quick long-term overview on trends in U.S. international trade. Chart 1 below shows U.S. net exports from 1980-2019. Net exports are defined as the exports of U.S. goods and services to other countries minus the imports of goods and services from other countries to the U.S. In other words, it shows the U.S. trade balance of goods and services with all countries. Beginning in 1980, the United States has consistently had negative net exports (a trade deficit), meaning that imports have exceeded exports in every year since 1980. The trade deficit hit an all-time high of nearly -$806 billion in the 3rd quarter of 2006. The shaded areas of the chart indicate recession periods. Net exports will generally decrease (the trade deficit will lessen) during recessions, as U.S. corporations and consumers buy less, meaning fewer goods and services will be imported.
Chart 1: U.S. Net Exports of Goods and Services 1980-2019 (Billions of dollars)
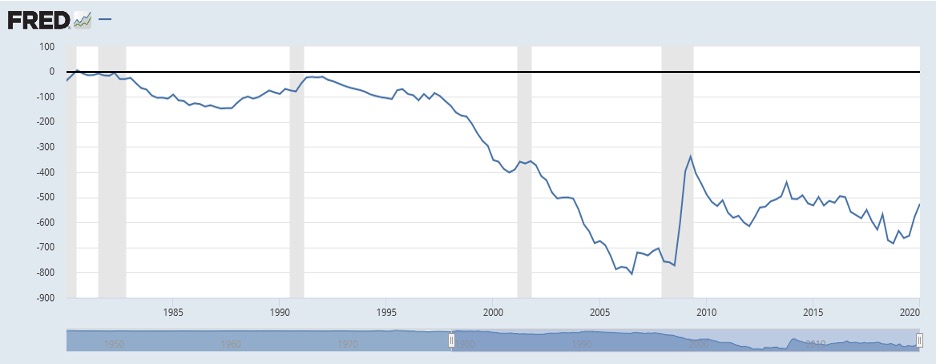
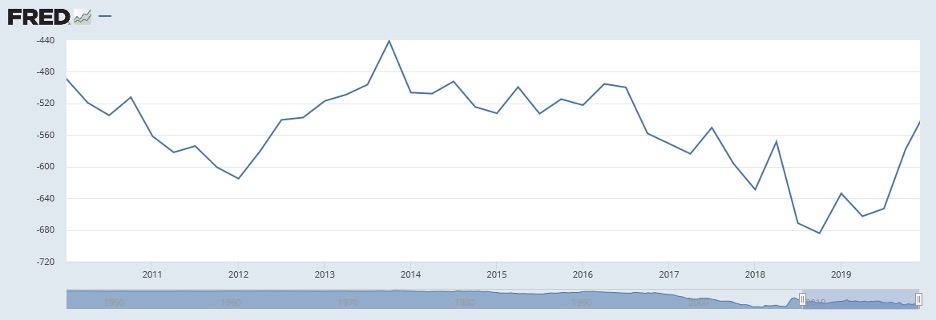
Chart 2 below focuses on U.S. net exports during the economic recovery period. What didn’t change was the fact that the United States had a trade deficit each year – consistent with every year since 1980. What did change was the magnitude of the trade deficit.
After beginning 2010 with a trade deficit of -$489 billion, the trade deficit generally increased and reached -$615 billion in early 2012. Between 2012-14 the trade deficit improved reaching -$441 billion in the 4th quarter of 2014, which was lowest trade deficit in the decade. Between 2014 and 2018 the trade deficit generally increased, reaching a decade high of -$684 billion in the 4th quarter of 2018. The trade deficit declined in 2019, decreasing to -$578 billion in the 4th quarter of 2019, which was approximately the same trade deficit as the 3rd quarter of 2017.
Summarizing, the United States has run a trade deficit ever since 1980, meaning that the U.S. imported more goods and services from other countries than it exported each year since 1980. The trade deficit hit an all-time high of nearly -$806 billion in the 3rd quarter of 2006. During the recent economic expansion, the trade balance fluctuated, improving to a decade low trade deficit in 2014 before reaching a decade high deficit in 2018.
Chart 2: U.S. Net Exports of Goods and Services 2010-19 (Billions of dollars)
China
What didn’t change over the economic recovery period was that the trade deficit with China remained the largest trade deficit that the U.S. had with any country. However, the amount of the deficit fluctuated, and that played a key role in U.S. trade with Vietnam.
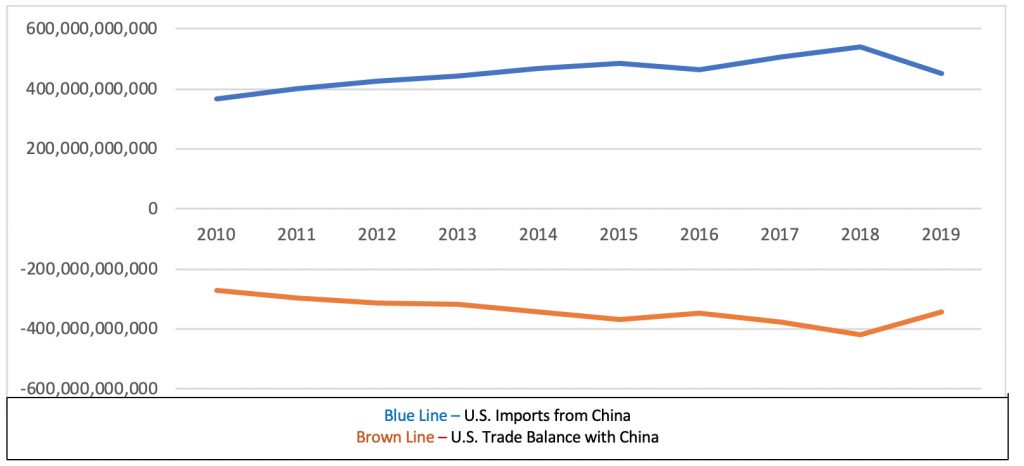
Chart 3 shows the U.S. merchandise trade with China from 2010 through 2019. The blue line indicates U.S. imports from China, while the brown line indicates the trade balance (exports minus imports) with China. U.S. imports from China began the decade at $365 billion and steadily grew through 2015 to $483 billion. After a slight decline in 2016, U.S. imports from China hit a record high of $539 billion in 2018 before decreasing to $452 billion in 2019. The trade balance mirrors the changes in imports, with the trade balance hitting a record high -$419 billion in 2018 before declining to -$345 billion in 2019.
Chart 3: U.S. Merchandise Trade with China 2010-19
Vietnam
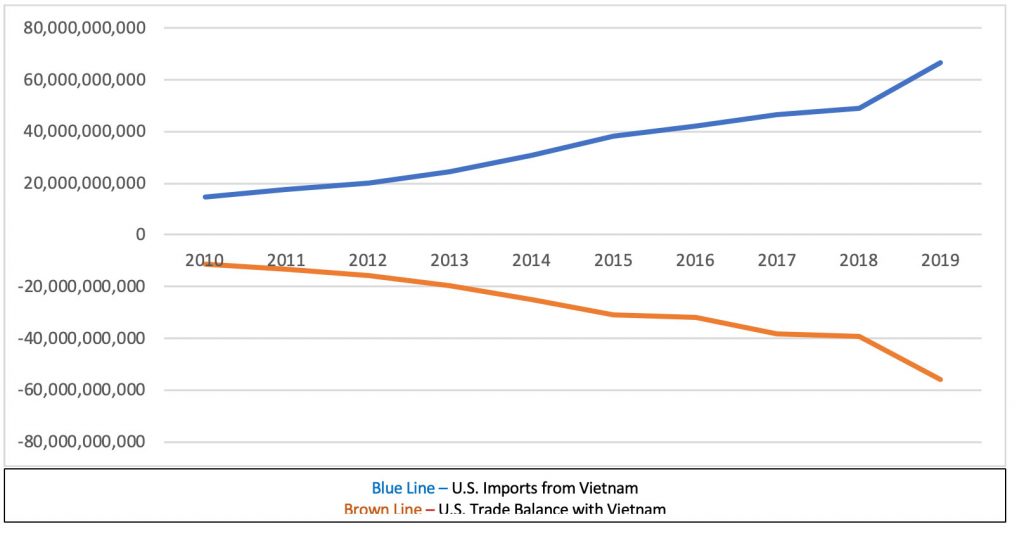
One thing that did change over the economic recovery period – trading with Vietnam. Chart 4 shows the U.S. merchandise trade with Vietnam from 2010 through 2019. The blue line indicates U.S. imports from Vietnam while the brown line indicates the trade balance (exports minus imports) with Vietnam. U.S. imports from Vietnam grew steadily throughout the decade, but significantly increased in 2019. Imports from Vietnam began the decade at $14.8 billion and grew to $49.2 billion in 2018. However, in 2019 imports from Vietnam grew 34.6% to a record high of $66.6 billion, an increase of $17.4 billion from 2018. During the economic recovery imports from Vietnam grew from $14.8 billion at the start of decade to $66.6 billion by the end of the decade and in 2019 Vietnam rose to 7th on the list of countries ranked by U.S. import volume. Vietnam ranked just behind South Korea, and just ahead of the United Kingdom.
The growing trade deficit with Vietnam reflects the increasing level of imports by the U.S. The U.S. trade deficit with Vietnam began the decade at $11.2 billion and steadily grew to $39.5 billion 2018. The trade deficit exploded to $55.8 billion in 2019, a $16.3 billion increase of 41.3%.
Chart 4: U.S. Merchandise Trade with Vietnam 2010-19
The United States began a tariff and trade war with China (and other countries) in 2018 that continued into 2019. A key benefactor of that trade war with China was Vietnam. U.S. corporations wanting to avoid paying the tariffs on Chinese sourced products looked elsewhere for sourcing. Although 2019 imports from China declined 16%, manufacturing employment remained fairly constant in the U.S. However, in 2019 U.S. imports from Vietnam increased 41%. For some U.S. companies, Vietnam became a viable sourcing alternative for their products.
For further information:
1. Federal Reserve
FRED Database: U.S. Net Exports
2. TradeStats Express
https://tse.export.gov/TSE/TSEHome.aspx
CBEI Series: The Economic Recovery 2010-19: What Changed and What Didn’t
Part 1: Overview
Part 2: Wealth Distribution
Part 3: Manufacturing Employment
Part 4: Trade with China … and the Rise of Vietnam
Part 5: Funding the U.S. Government – Corporate vs. Individual Taxes
Part 6: Corporate Debt and Collateralized Loan Obligations

Kevin Bahr is a professor emeritus of finance and chief analyst of the Center for Business and Economic Insight in the Sentry School of Business and Economics at the University of Wisconsin-Stevens Point.