During the economic recovery the split between how individual and corporate taxes comprised total federal tax revenues changed, primarily as a result of the 2018 federal tax changes. Before we review what happened in the last decade during the economic recovery, a long-term view of what has changed.
Chart 1 below shows the percentage composition of federal tax receipts that corporate and individual income taxes provided to the U.S. government over a 50-year period, from 1960 through 2019. (Other tax revenue sources for the federal government include Social Security taxes and excise taxes.) Since 1960, there has been a general decline in the percentage of federal tax receipts that corporate income taxes have provided. In 1960, corporate income taxes provided 23.2% of federal income tax receipts; the number has generally declined ever since. In the 1970s, the highest percentage of federal tax receipts provided by corporate income taxes was 17.0% in 1970. The decline continued in the 1980s, with the percentage of federal tax receipts provided by corporate income taxes at a decade high of 12.5% in 1980. In the 1990s, 11.8% was the decade high in 1996. A reversal occurred after the turn of the century, with the percentage of federal tax receipts provided by corporate income taxes hitting a decade high of 14.7% in 2006.
The trend for individual taxes as a percentage of federal tax receipts has fluctuated but generally increased since 1960. Between 1960 and 1999 the rate fluctuated with the lowest percentage of federal tax receipts provided by individual taxes at 41.3% in 1967 and the highest at 48.2% in 1982. In 2001 the percentage of federal tax receipts comprised by individual taxes rose to 49.9%, a high for the decade.
Chart 1: Percentage of U.S. Federal Tax Receipts – Corporate vs. Individual Income Taxes (1960-2019)
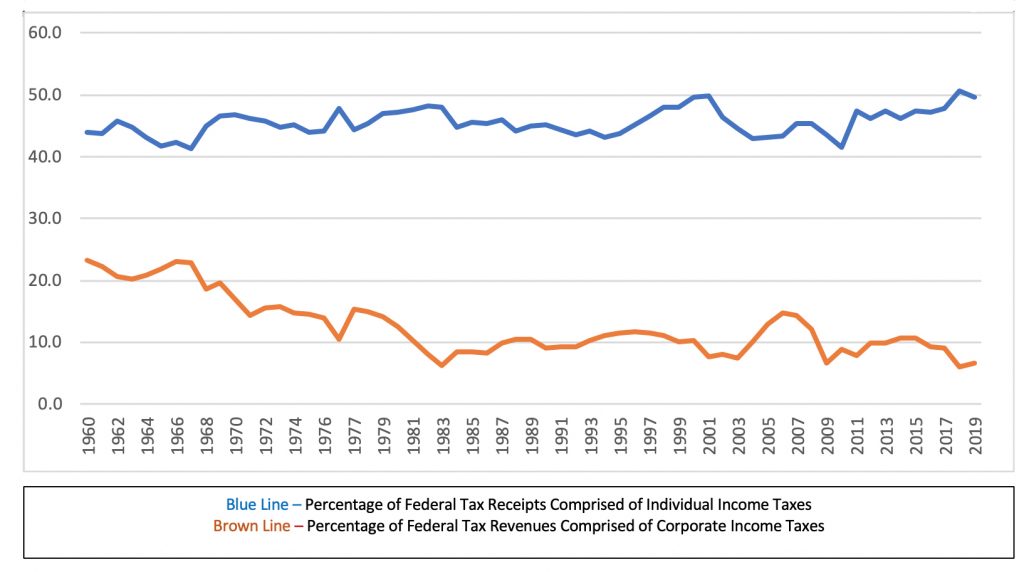
Table 1 below shows the percentage composition of federal tax receipts that corporate and individual income taxes provided to the U.S. government over the last decade during the economic recovery.
Table 1: Percentage of U.S. Federal Tax Receipts – Corporate vs. Individual Income Taxes (2010-19)
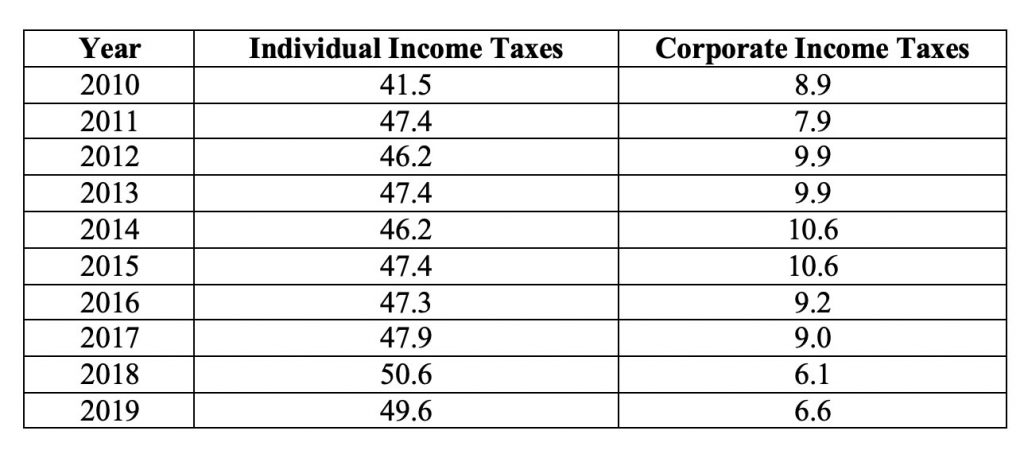
In fiscal year 2018, corporate income taxes comprised 6.1% of federal tax revenue. The 6.1% rate was not only the lowest of the decade, it was the lowest rate ever based on Office of Management and Budget data available since 1934. Conversely in fiscal year 2018, the contribution of individual income taxes to total federal tax revenue increased. Federal income tax revenue from individual income taxes comprised 50.6% of federal tax revenue in fiscal year 2018. The 50.6% rate for individual income taxes was not only the highest of the decade, it was the highest rate ever based on Office of Management and Budget data available since 1934.
During the economic recovery, the split between how individual and corporate income taxes comprised total federal tax revenues changed significantly, with the percentage of federal tax revenues increasing for individual income taxes and decreasing for corporate income taxes. In 2007, generally before the effects of the financial crisis, individual income taxes provided 45.3% of federal tax revenues while corporate income taxes provided 14.4%. Those numbers changed significantly during the economic recovery. In 2019 the percentage of federal tax revenues provided by individual income taxes grew to 49.6%, while corporate income taxes declined to only 6.6%.
For further information:
From the Office of Management and Budget, tax revenue by source (see Tables 2.1 and 2.2): https://www.whitehouse.gov/omb/historical-tables
CBEI Series: The Economic Recovery 2010-19: What Changed and What Didn’t
Part 1: Overview
Part 2: Wealth Distribution
Part 3: Manufacturing Employment
Part 4: Trade with China … and the Rise of Vietnam
Part 5: Funding the U.S. Government – Corporate vs. Individual Taxes
Part 6: Corporate Debt and Collateralized Loan Obligations

Kevin Bahr is a professor emeritus of finance and chief analyst of the Center for Business and Economic Insight in the Sentry School of Business and Economics at the University of Wisconsin-Stevens Point.